What is throughput in project management? Definition, formula, and examples
Introduction
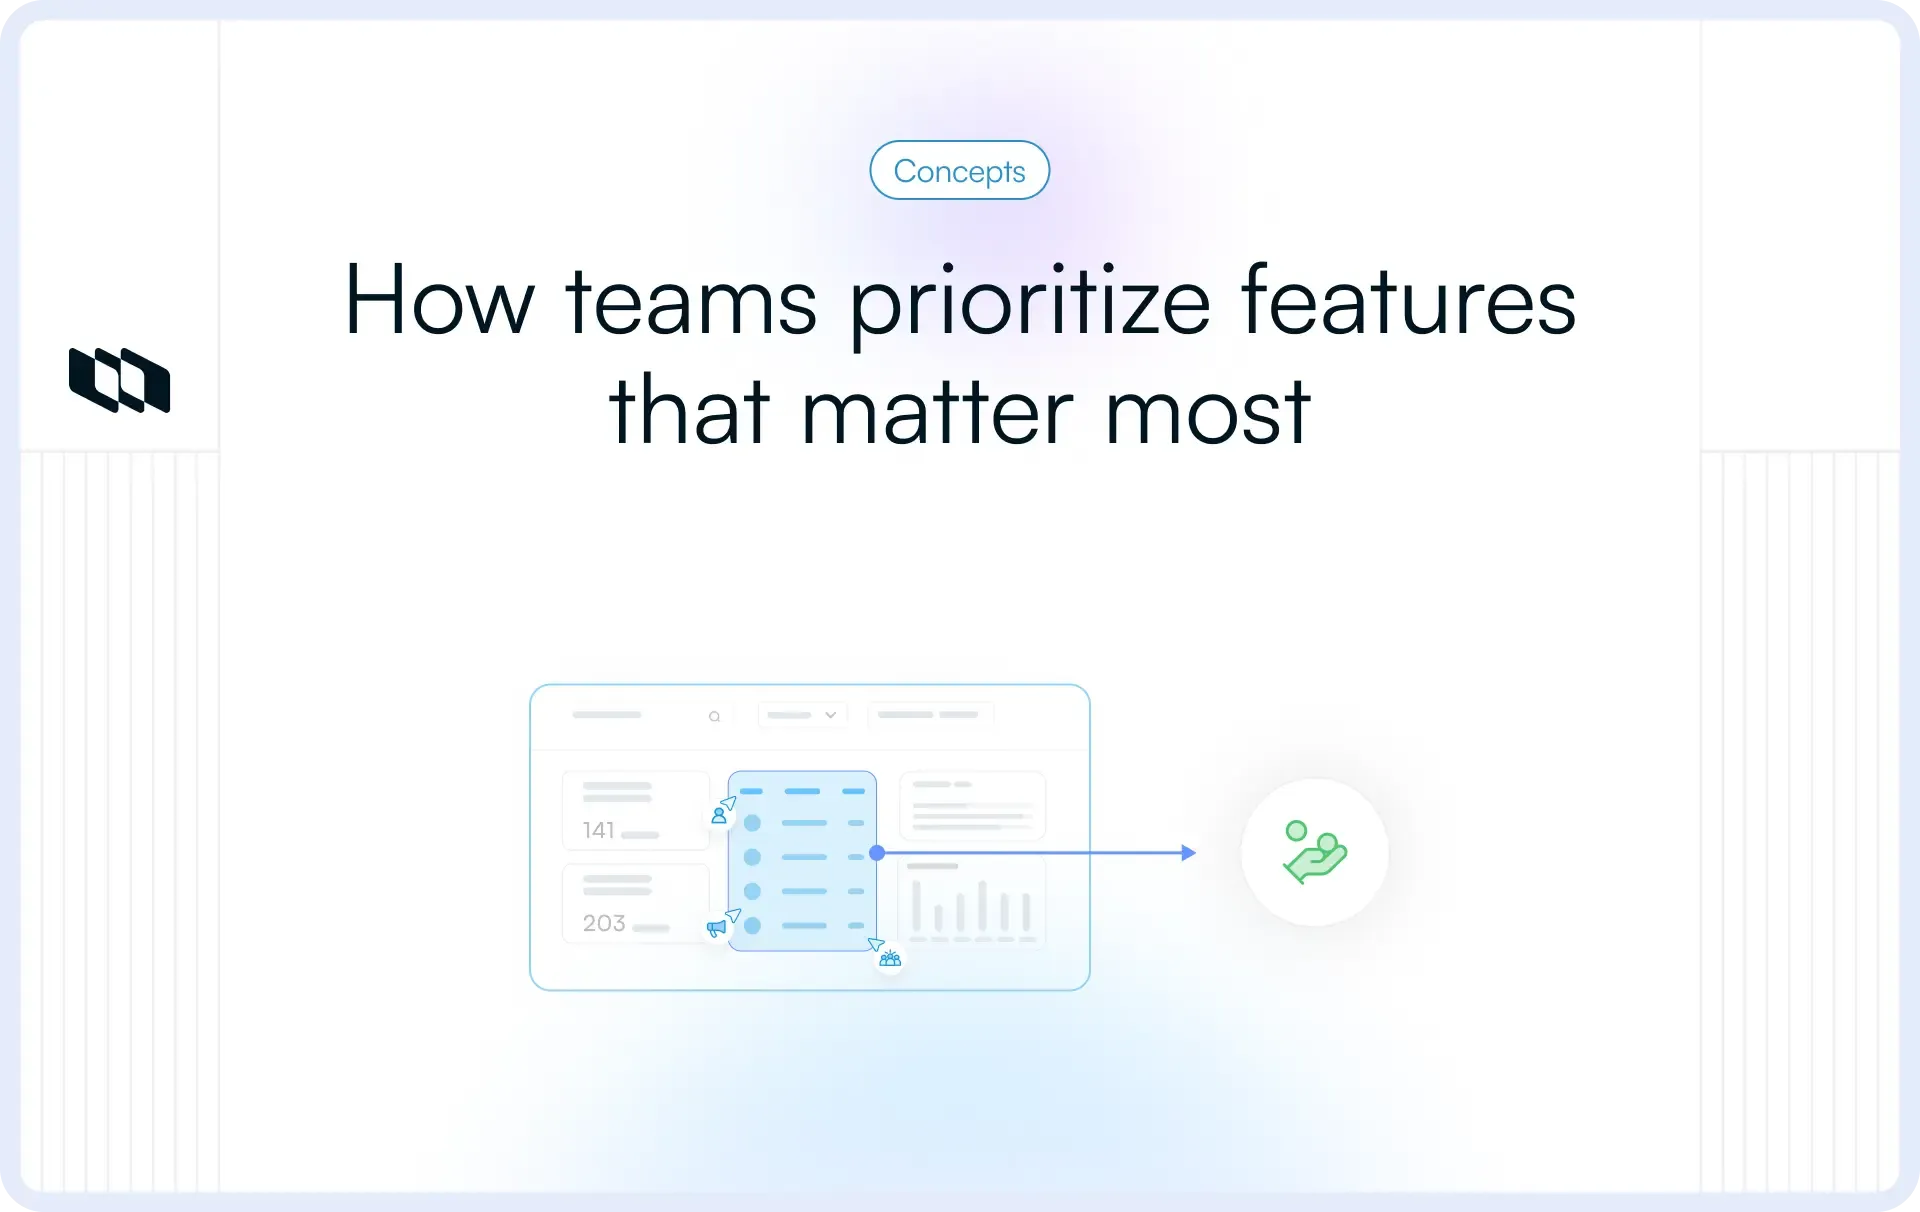
Teams often stay busy across delivery cycles, yet leaders still need clarity on how much work actually reaches completion. Throughput in project management measures how many work items move from start to finish within a defined period, helping teams more accurately understand delivery capacity. This guide explains what the throughput metric means, how to calculate team throughput, how it differs from velocity and cycle time, and how teams use project management throughput to improve planning, forecasting, and workflow performance.
What is throughput in project management?
Throughput refers to the number of work items completed during a specific time window, such as a week or sprint. Work items may include tasks, user stories, bugs, or change requests, depending on how a team structures delivery tracking. Unlike estimation metrics that reflect effort or complexity, project management throughput focuses on the rate of completed output across a workflow.
Throughput measures the number of work items a team completes within a defined time period. Teams typically track throughput per day, week, sprint, or release cycle to understand delivery pace across ongoing work. This throughput metric helps teams observe execution patterns and assess how consistently work moves through their workflow over time.
What throughput actually measures
Throughput reflects how consistently a team completes work across delivery cycles, rather than how intensively team members remain occupied during execution. It provides a practical view of delivery stability and helps teams understand how much work typically reaches completion within a predictable time frame. In practice, team throughput answers a simple operational question: how much work reaches done status over time.
Where throughput is commonly used
Throughput is a cross-framework execution metric. It appears across delivery environments of all kinds:
- Agile teams track completed stories or tasks per sprint
- Kanban systems monitor the flow rate as work moves across the board
- Lean workflows measure process output against cycle time
- Flow-based delivery environments that prioritize finishing work over starting new items
- Modern project analytics frameworks connect team output to business outcomes
The common thread across all of these is the focus on completed work. Whether a team runs two-week sprints or a continuous delivery pipeline, throughput gives them a consistent, comparable signal of how effectively work moves through the system.
Why throughput matters in project management
Throughput is not just a measurement exercise. It directly shapes how teams plan, forecast, and deliver. Here is why it earns a place in any serious project management framework.
1. Helps teams understand delivery capacity
Team throughput indicates how many work items are typically completed within a defined time window, such as a sprint or release cycle. This creates a practical view of delivery capacity based on historical execution patterns. As a result, teams plan upcoming work with clearer expectations aligned to observed output trends.
2. Improves forecasting accuracy
Historical throughput supports more reliable delivery forecasts because it reflects real completion behavior rather than estimated effort. When team throughput remains stable across iterations, planning milestones and release timelines becomes more structured and predictable for both engineering teams and stakeholders.
3. Reveals workflow bottlenecks early
Changes in throughput often reflect shifts inside the delivery system. Lower throughput may indicate blocked work, overloaded execution stages, approval dependencies, or unclear ownership across workflow transitions. Tracking throughput over time helps teams identify these constraints earlier and respond with targeted workflow adjustments.
4. Keeps teams focused on finishing work
The throughput metric encourages teams to prioritize completing active work items rather than expanding parallel activity across the backlog. This focus strengthens flow efficiency and supports steady progress across projects that depend on coordinated delivery between product, engineering, and operations teams.
How to calculate throughput
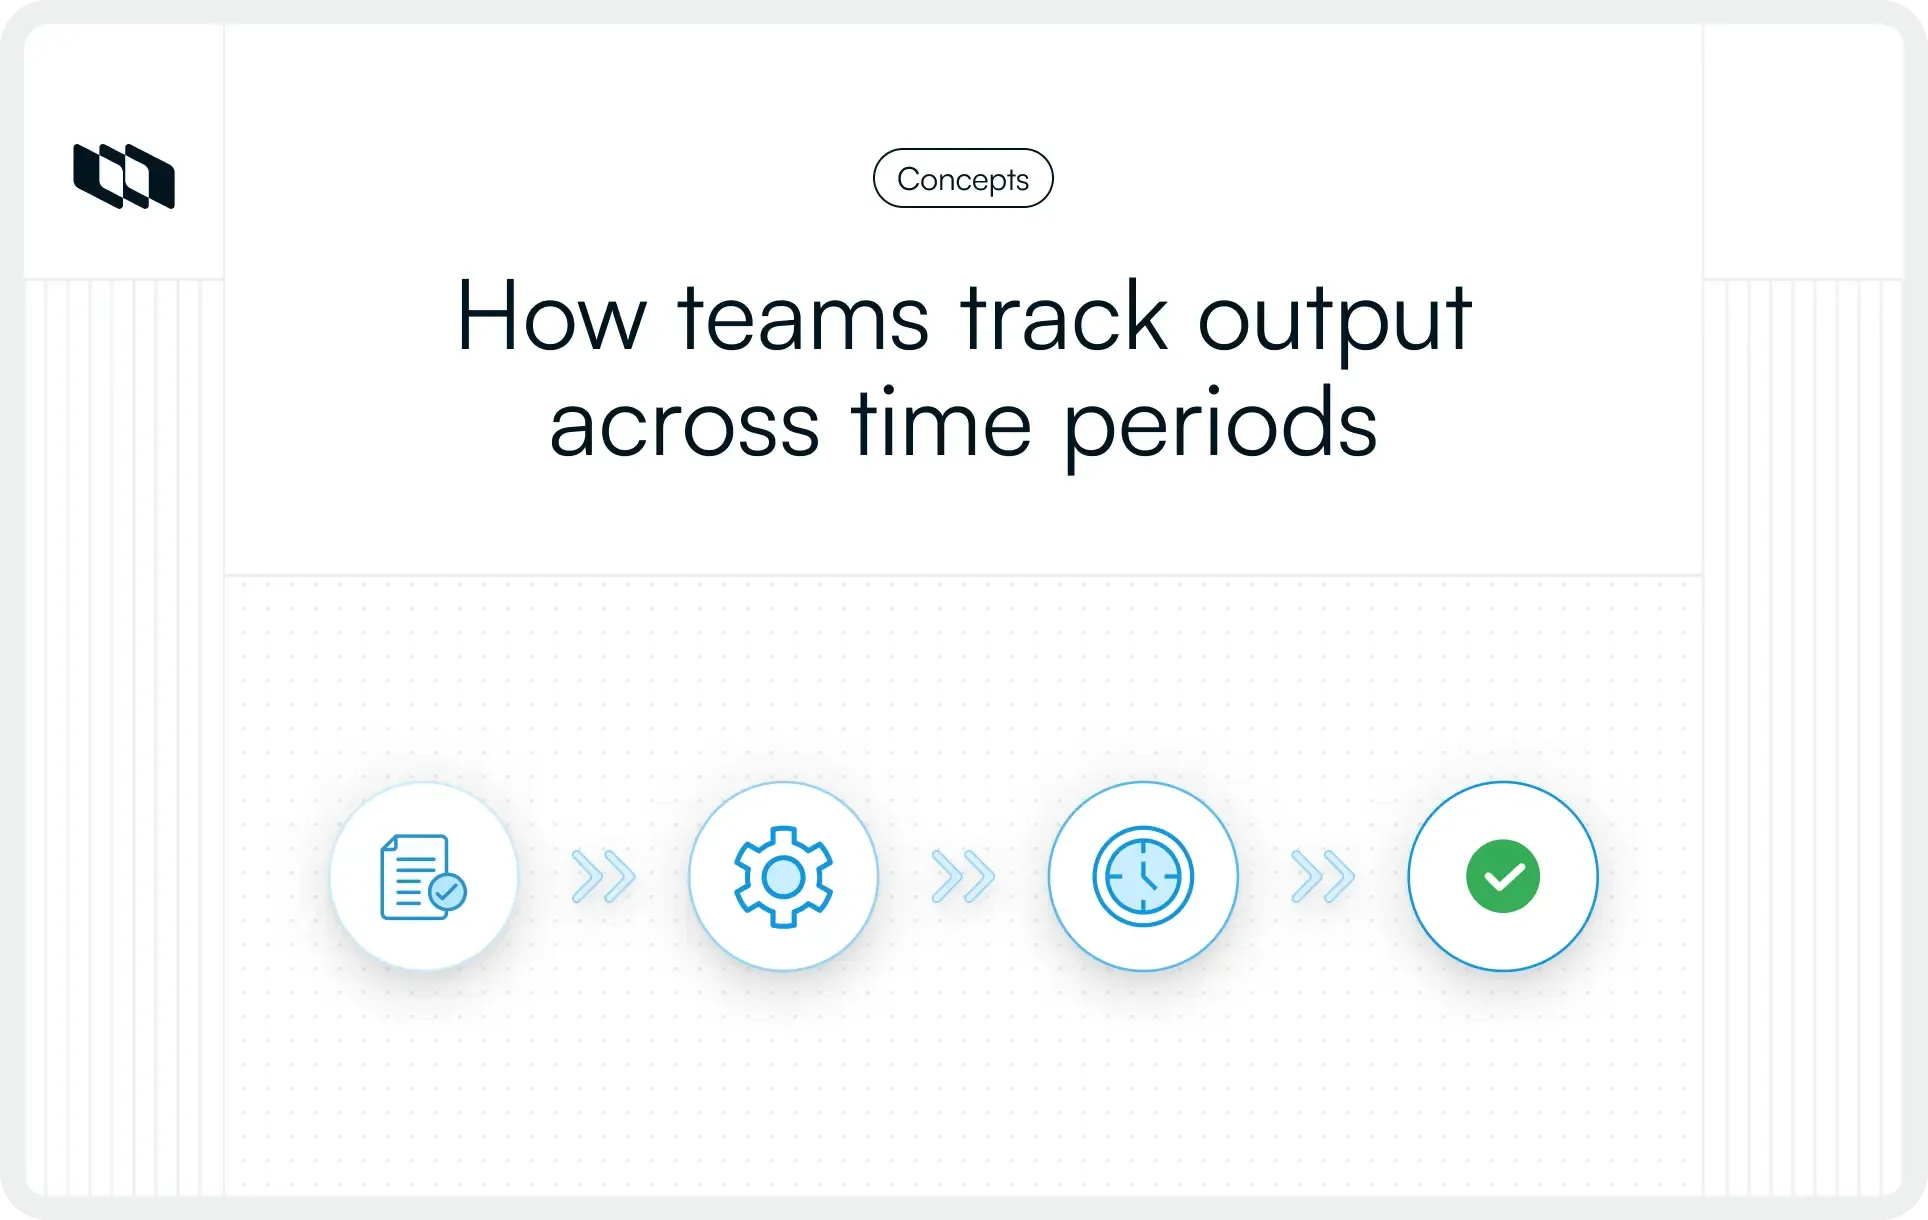
Teams calculate throughput in project management by counting how many work items reach completion within a defined time window. The method stays simple and works across Agile teams, Kanban workflows, and release-based delivery environments. A clear approach to calculation helps teams interpret the throughput metric consistently across planning cycles.
Basic throughput formula
Throughput equals the number of completed work items divided by the selected time period. Teams typically count items such as tasks, user stories, bugs, or tickets that reach done status within a sprint, week, or release window. This calculation focuses on finished output rather than effort, duration, or estimation units. As a result, the throughput metric provides a direct view of delivery rate across active workflows.
Example of throughput calculation
For example, if a team completes 24 tasks over 4 weeks, the project management throughput is 6 tasks per week. The same approach applies to sprint cycles, monthly planning windows, or release phases because the calculation method remains consistent across delivery contexts. Teams track these patterns over time to understand how team throughput changes as workflows evolve.
Choosing the right measurement timeframe
Teams select throughput timeframes based on planning needs and delivery structure. Daily throughput helps teams observe short-term execution patterns in fast-moving environments such as support or maintenance workflows. Weekly throughput supports capacity planning across cross-functional teams working on parallel tasks.
Sprint throughput helps Agile teams evaluate iteration-level delivery consistency and refine backlog planning decisions. Release throughput provides a broader view of delivery progress across longer roadmap milestones and helps leadership teams interpret execution trends at the portfolio level.
What counts toward throughput and what does not
Throughput is only as reliable as what goes into it. Teams that count the wrong things end up with a number that looks like a metric but behaves like noise. Getting the inputs right is what makes throughput actionable.
1. Only completed work should be counted
Throughput includes only work items that reach a defined done status within the selected time period. Items that remain in progress, are partially completed, or are blocked during execution do not contribute to team throughput because they do not represent finished deliverables. Counting only completed work ensures that the throughput metric reflects actual progress across workflows rather than intermediate activity levels.
2. Keep work item types consistent
Reliable throughput tracking requires teams to measure comparable work items across time windows. Tasks, bugs, stories, and epics represent different levels of delivery scope, so combining them within a single throughput calculation reduces interpretability. Teams often track separate throughput views for different work item categories to maintain clarity across execution analysis.
3. Throughput measures quantity, not effort
Throughput measures how many work items are completed, while story points represent the estimated effort or complexity of those items. Because of this difference, project management throughput works best alongside estimation-based metrics rather than replacing them. Teams that combine throughput with effort signals gain a clearer understanding of delivery rate and workload characteristics across planning cycles.
Throughput vs. other project management metrics
Throughput does not operate in isolation. To use it well, teams need to understand how it relates to the other metrics sitting alongside it in most delivery frameworks. Each measures something distinct, and confusing them leads to misreading team performance.
Throughput vs. velocity
Velocity measures the amount of effort estimated to be completed during a sprint, usually expressed in story points.
Throughput measures how many work items are completed during a given period. Agile teams often use velocity for estimation-based sprint planning, while team throughput helps teams understand delivery consistency across iterations. Using both metrics together improves planning confidence by giving teams visibility into effort patterns and completion trends.
Throughput vs. cycle time
Cycle time measures how long a work item takes to move from active work to completion. Throughput measures how many items are completed within a specified time window.
Cycle time explains delivery speed at the item level, while throughput explains delivery volume at the system level. Teams that track both metrics gain a clearer understanding of how workflow efficiency influences output across delivery cycles.
Throughput vs. Lead time
Lead time measures the total elapsed time from when a request enters the workflow to when it reaches completion. Throughput measures how frequently completed work exits the workflow over time.
Lead time helps teams understand responsiveness to incoming work, while project management throughput reflects the system's overall delivery rate.
Throughput vs. work in progress (WIP)
Work in progress represents the number of items currently active within the workflow. Throughput is the number of items that are completed during a defined time period. Managing work in progress carefully supports more stable team throughput because smaller active workloads allow work items to move through workflow stages with fewer delays.
Why these metrics work best together
No single metric tells the full delivery story. Throughput, cycle time, lead time, and WIP are flow metrics that form a system. Each one illuminates a different dimension of how work moves through a team's process.
Metric | What it answers |
Throughput | How much work is the team finishing over time? |
Cycle time | How long does it take to finish a single item? |
Lead time | How long does it take from request to delivery? |
WIP | How much work is actively in flight right now? |
Used together, they give teams, engineering managers, and project leads a complete, real-time view of delivery health. A drop in throughput paired with rising WIP and increasing cycle time points to a system under strain. Stable throughput, short cycle times, and controlled WIP signal a team operating at a sustainable, predictable pace.
How teams use throughput in real project workflows
Understanding throughput as a concept is one thing. Using it to make better decisions in day-to-day delivery work is another. Here is how high-performing teams put throughput to practical use across their workflows.
1. Capacity planning
Teams use team throughput to understand how many work items typically reach completion within a planning window, such as a sprint or release cycle. This creates a realistic baseline for selecting backlog items and aligning scope with available delivery capacity. Over time, consistent throughput tracking helps teams refine expectations across changing project priorities.
2. Sprint and iteration planning
Historical throughput improves commitment reliability during sprint planning because it reflects actual completion patterns across previous iterations. Stable team throughput supports balanced sprint scope selection and helps teams maintain steady execution across recurring delivery cycles. This approach strengthens alignment between backlog structure and execution capacity.
3. Delivery forecasting
Throughput trends help teams estimate delivery ranges based on observed workflow behavior across multiple cycles. Instead of relying on fixed-timeline assumptions, teams analyze project management throughput patterns to understand how much work typically moves through the system within a given timeframe. This supports planning decisions across roadmap milestones and release checkpoints.
4. Continuous workflow improvement
Teams compare throughput patterns before and after workflow adjustments to evaluate how process changes influence delivery performance. Improvements in review cycles, dependency management, or task sizing often appear as clearer, more stable throughput across iterations. Tracking these patterns helps teams refine execution strategies using measurable workflow signals.
How to analyze throughput trends effectively
Collecting throughput data is the easy part. Most teams stop there. The teams that actually improve their delivery systems go further; they analyze throughput over time, break it apart by work type, and use the patterns to ask sharper questions about how their workflows are structured.
1. Look beyond averages
Average team throughput provides a useful summary of completion volume across a time window, yet averages alone do not explain how consistently work moves through the workflow. A team that completes a similar number of items each iteration demonstrates stable delivery capacity, while a large variation across cycles signals uneven execution conditions. Consistent throughput patterns support more reliable planning decisions across project environments.
2. Track throughput over time
Tracking project management throughput across multiple iterations helps teams observe delivery stability and identify shifts in execution capacity. Long-term throughput patterns often reflect changes in team structure, backlog composition, or workflow maturity. Reviewing these trends helps teams evaluate whether process adjustments improve delivery performance across planning cycles.
3. Segment throughput by work type
Segmenting throughput by work category improves interpretation accuracy because different work types follow distinct execution paths. Features often move through longer delivery cycles than maintenance tasks, while bugs and support requests typically follow shorter resolution timelines. Tracking team throughput separately across these categories creates clearer visibility into how work moves through the delivery system.
4. Identify patterns across delivery cycles
Recurring spikes or drops in throughput often reflect structural workflow conditions rather than isolated execution events. Review cycles, dependency coordination, backlog refinement practices, and release preparation activities influence completion patterns across iterations. Identifying these recurring signals helps teams adjust workflow design and strengthen delivery consistency over time.
Factors that affect throughput in project environments
Throughput does not exist in a vacuum. It is a direct reflection of how well a team's workflow, structure, and environment support completing work. These are the five factors that most consistently influence throughput in real project environments.
1. Work in progress levels
Work in progress directly impacts team throughput because active work spread across too many items reduces the flow of completions. When teams carry a large number of simultaneous tasks, attention gets divided across priorities, and work spends more time waiting between stages. Lower work in progress supports steadier movement toward completion and creates more stable throughput patterns.
2. Workflow bottlenecks
Bottlenecks slow delivery by creating congestion at specific points in the workflow. Review queues, approval stages, testing dependencies, and cross-functional handoffs often reduce throughput when work reaches these stages faster than it can progress. Identifying bottlenecks helps teams understand where completion rates are losing momentum across the system.
3. Task size variability
Throughput becomes harder to interpret when work items vary widely in size and scope. A week filled with small maintenance tasks produces a different output pattern than a week focused on larger feature work, even when the number of completed items looks similar. More consistent task sizing makes the throughput metric easier to read and more useful for planning.
4. Team structure and experience
Team composition shapes project management throughput because delivery consistency depends on shared context, role clarity, and familiarity with the execution process. New team members, ownership changes, or shifts in collaboration structure often influence how work flows through active projects. Over time, stable teams with clear working patterns usually develop more predictable throughput behavior.
5. Interruptions and shifting priorities
Frequent interruptions affect throughput by pulling attention away from work already in progress. Priority changes, urgent requests, and context switching create additional workflow friction and reduce the rate at which items reach completion. Teams that protect focus across active workstreams usually see stronger throughput stability across delivery cycles.
How to improve throughput without reducing quality
Improving throughput is not about asking teams to work faster or cut corners on quality. It is about removing the friction, ambiguity, and structural inefficiencies that slow work down before it even reaches the people doing it. These five practices consistently move the needle without compromising output standards.
1. Break work into smaller items
Smaller work items move through workflow stages with fewer delays because they require less coordination across dependencies and review checkpoints. Teams that structure backlog items at a manageable level gain clearer visibility into completion patterns and develop more predictable team throughput across iterations.
2. Limit work in progress
Limiting work in progress supports a steady flow of completion because teams focus on finishing active items before expanding parallel execution. Controlled work in progress reduces wait times between workflow stages and improves throughput stability across delivery cycles.
3. Remove recurring blockers
Recurring blockers reduce throughput by slowing work at predictable transition points such as review stages, approval queues, or dependency handoffs. Teams that closely monitor workflow transitions can identify where items lose momentum and adjust processes to maintain smoother delivery across projects.
4. Standardize definitions of done
Clear definitions of done ensure that completed work meets consistent quality expectations across delivery cycles. When completion criteria remain stable across teams and projects, the throughput metric reflects reliable execution patterns and supports more accurate planning decisions.
5. Review throughput trends regularly
Regular review of throughput trends helps teams evaluate whether workflow adjustments improve delivery performance over time. Tracking project management throughput across multiple cycles allows teams to interpret execution signals more effectively and refine planning strategies using consistent completion data.
Common mistakes teams make when using throughput
Throughput is a straightforward metric to collect and a surprisingly easy one to misuse. These are the five mistakes that consistently undermine its value in real project environments.
1. Treating throughput as a productivity score
Throughput reflects completion patterns across workflows rather than individual contribution levels. Teams that interpret team throughput as a performance indicator shift attention away from delivery stability and toward activity comparison. Using throughput as a planning signal instead supports healthier alignment in execution across product and engineering teams.
2. Comparing teams with different work types
Teams working on infrastructure improvements, feature development, maintenance tasks, or support requests operate under different delivery conditions. Comparing project management throughput across these environments yields misleading conclusions because completion patterns depend on the work structure and the depth of dependencies. Throughput interpretation works best within the context of a single workflow system.
3. Ignoring variability in work item size
Large variation in work item size affects how teams interpret throughput trends across planning cycles. A delivery window dominated by smaller fixes yields different completion counts than one focused on larger feature work. Consistent backlog structure improves the reliability of throughput signals across iterations.
4. Measuring throughput in isolation
Throughput provides stronger insights when teams interpret it alongside cycle time, lead time, and work in progress. These related flow metrics explain how quickly work moves through the system, how long requests remain in the system, and how workload is distributed across workflow stages. Together, they create a clearer picture of delivery behavior across project environments.
5. Assuming higher throughput always means better outcomes
Higher throughput indicates greater volume of completed work, but its impact on delivery depends on whether the completed work aligns with project priorities and stakeholder goals. Teams that evaluate throughput together with delivery value and roadmap alignment develop stronger execution strategies across planning cycles.
Closing thoughts
Throughput in project management gives teams a clear view of how consistently work reaches completion across delivery cycles. Instead of relying only on effort estimates or activity levels, teams use the throughput metric to understand execution capacity, evaluate workflow stability, and improve planning accuracy across iterations and releases. When tracked over time, project management throughput helps teams interpret delivery patterns with greater confidence and align scope with realistic completion expectations.
Throughput becomes most valuable when used alongside cycle time, lead time, and work in progress to create a complete view of delivery behavior. Teams that interpret these flow metrics together develop stronger visibility into workflow performance and make more informed decisions across roadmap planning, sprint execution, and continuous improvement initiatives.
Frequently asked questions
Q1. What is throughput in a project?
Throughput in a project refers to the number of work items a team completes within a specific time period, such as a sprint, week, or release cycle. It helps teams understand delivery capacity and track how consistently work moves to completion across workflows. Project management throughput supports planning decisions by showing how much work typically reaches done status over time.
Q2. What exactly is throughput?
Throughput is a delivery metric that measures how many tasks, stories, bugs, or tickets a team completes during a defined timeframe. Unlike effort-based metrics, the throughput metric reflects completion rate across a workflow and helps teams evaluate execution stability across iterations and releases.
Q3. What is KPI for throughput?
Throughput becomes a key performance indicator when teams use it to monitor delivery consistency across planning cycles. As a KPI, team throughput helps engineering leaders and project managers evaluate execution trends, detect workflow constraints, and align backlog scope with realistic delivery capacity. It works best alongside cycle time, lead time, and work in progress to provide full visibility into execution.
Q4. How do you calculate throughput?
Teams calculate throughput by dividing the number of completed work items by a selected time period. For example, if a team completes 30 tasks in 5 weeks, throughput equals 6 tasks per week. This calculation helps teams interpret delivery pace across sprints, iterations, or release windows and supports more structured forecasting decisions.
Q5. What are the 4 pillars of Agile?
The four widely recognized pillars of Agile delivery practices are individuals and interactions, working software, customer collaboration, and responding to change. These principles guide how Agile teams organize work, prioritize feedback loops, and maintain adaptability across evolving project requirements.
Recommended for you