What is revenue forecasting for product teams?
Introduction
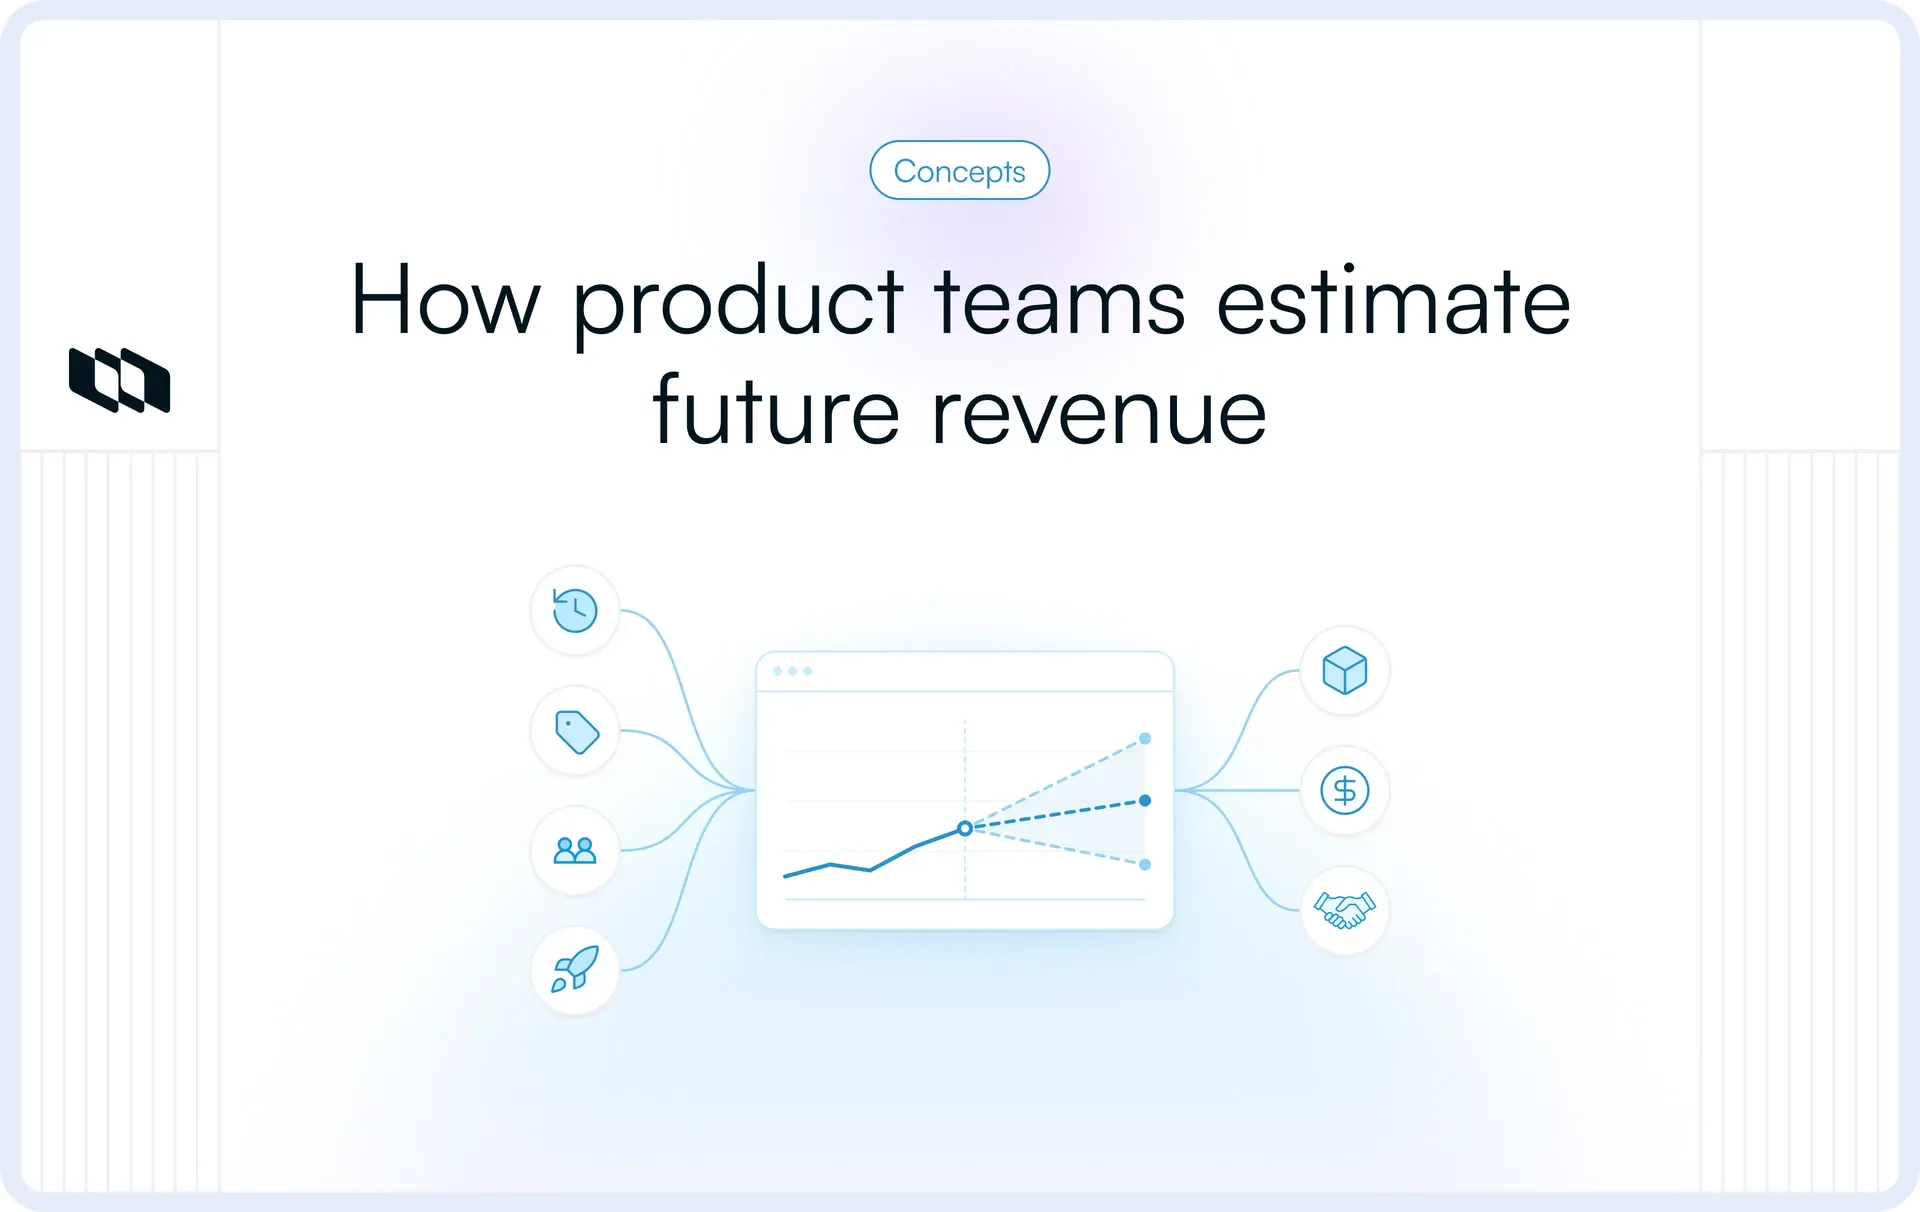
Revenue forecasting helps product teams estimate how future product decisions may affect revenue. It brings together signals such as adoption, pricing, retention, expansion, pipeline, and launch timing to create a forward-looking view of expected performance.
For product managers, a revenue forecast can support roadmap prioritization, investment decisions, and cross-functional planning. This guide explains how product revenue forecasting works, which revenue forecasting methods and models are most useful, how to build a revenue forecast, and how product teams can improve forecast accuracy over time.
What is revenue forecasting?
Revenue forecasting is the process of estimating how much revenue a business is likely to generate over a future period. A revenue forecast uses current performance, historical trends, customer behavior, sales activity, pricing, and other relevant assumptions to build a reasoned view of expected revenue.
For product teams, the forecast usually focuses on the revenue impact of specific product decisions. A product revenue forecast might estimate how a new launch, pricing change, improved conversion rate, higher adoption, reduced churn, or expansion feature could affect future revenue.
This differs from company-level financial forecasting, which usually covers a broader set of financial outcomes, including total revenue, expenses, cash flow, margins, and profitability. Product revenue forecasting works at a more focused level, helping product managers connect product performance and roadmap decisions with commercial outcomes.
The forecasting period depends on the decision being made. Product teams may use:
- Monthly forecasts for short-term changes in adoption, conversion, usage, or churn.
- Quarterly forecasts for roadmap planning, launches, pricing changes, and business reviews.
- Annual forecasts for longer-term investment, hiring, portfolio, and strategic planning.
Many teams use several forecasting periods together. A quarterly revenue forecast, for example, can guide near-term product planning while feeding into the company's annual financial model.
Revenue forecast vs. sales forecast vs. revenue target
These terms often appear together, but they serve different purposes.
Term | What it represents | Typical inputs |
Revenue forecast | An estimate of the revenue the business is expected to generate over a defined period | Historical revenue, customer behavior, pricing, retention, expansion, pipeline, and product assumptions |
Sales forecast | An estimate of expected sales based largely on current and future sales opportunities | Pipeline value, deal stages, win rates, sales cycles, and rep performance |
Revenue target | The revenue outcome the business wants to achieve | Strategic goals, growth plans, budgets, and leadership expectations |
Revenue projection | An estimate of future revenue based on a specific set of assumptions or scenarios | Growth assumptions, market conditions, pricing, customer volume, and modeled scenarios |
The distinction matters because each number answers a different planning question. A revenue target establishes the desired outcome, while a revenue forecast estimates what current evidence suggests is likely. A revenue projection is useful for exploring what could happen under a particular set of assumptions, while a sales forecast focuses more narrowly on expected selling activity.
For product teams, these views often come together. A revenue target can shape investment priorities, the sales forecast can provide demand signals, and the product revenue forecast can show how changes in adoption, retention, pricing, or product usage may influence the final outcome.
Why is revenue forecasting important for product teams?
Revenue forecasting gives product teams a clearer way to connect product decisions with expected commercial impact.
- Connect product investments to business outcomes: Revenue forecasting helps teams estimate how investments in new features, infrastructure, pricing, or customer experience could influence future revenue.
- Prioritize roadmap opportunities: Expected revenue impact gives product managers another input when comparing competing initiatives, especially when several opportunities require similar engineering effort or capacity.
- Evaluate launches, pricing, and packaging decisions: Teams can model how a new product launch, tier change, add-on, or pricing adjustment may affect acquisition, expansion, and overall revenue.
- Understand adoption, retention, and expansion: Product behavior often influences revenue indirectly. Forecasting helps teams connect changes in activation, usage, churn, renewals, and upsells with their potential financial impact.
- Support resource and capacity planning: A revenue forecast can inform decisions about engineering capacity, hiring, infrastructure, and other investments needed to support expected product growth.
- Align Product, Finance, and GTM teams: A shared forecast gives teams a common set of assumptions about launches, demand, customer behavior, pipeline, and expected revenue, making planning and trade-offs easier to discuss.
If you want to understand how business outcomes translate into product priorities, check out our guide to building a product strategy.
What drives a product revenue forecast?
A product revenue forecast is only as useful as the assumptions behind it. Product teams need to combine financial data with signals from customer behavior, product usage, sales activity, and upcoming roadmap changes.
Revenue driver | Signal to track | How it affects the forecast |
Historical revenue and growth | MRR, ARR, revenue growth rate, historical trends | Provides the baseline for estimating future performance and identifying whether growth is accelerating, slowing, or remaining stable. |
Customer acquisition and conversion | New customers, sign-ups, trial-to-paid conversion, win rates | Higher acquisition or conversion can increase expected new revenue, while weaker conversion may lower the forecast. |
Product adoption and usage | Activation rate, feature adoption, active users, usage frequency | Shows whether customers are reaching value and using the product enough to support conversion, retention, or usage-based revenue assumptions. |
Pricing and average revenue per customer | ARPU, ARPA, ACV, plan mix, realized price | Changes in pricing, packaging, discounts, or customer mix directly affect the amount of revenue generated per customer. |
Expansion and upsell | Upgrades, additional seats, add-ons, increased usage | Indicates how much additional revenue may come from existing customers beyond their initial purchase. |
Retention, churn, and renewals | Customer churn, revenue churn, renewal rate, contraction | Determines how much existing revenue is likely to remain in future periods and how much may be lost through churn or downgrades. |
Sales pipeline and deal size | Pipeline value, stage conversion, average deal size, sales cycle | Helps estimate future revenue from deals already in progress, particularly for enterprise and sales-led products. |
Product launches and roadmap timing | Release dates, rollout plans, dependencies, adoption assumptions | Delays or changes in launch timing can shift when expected revenue appears and reduce the contribution within a forecasting period. |
Seasonality, competition, and market conditions | Seasonal demand, competitor activity, economic conditions, market growth | External factors can change demand, pricing pressure, conversion rates, and customer spending patterns even when product performance remains stable. |
The weight of each driver depends on the product and its revenue model. A product-led SaaS business may rely heavily on activation, conversion, usage, and retention data, while an enterprise product may place more weight on pipeline quality, deal size, renewals, and sales-cycle timing.
For a deeper look at the adoption, activation, retention, and usage signals behind these assumptions, see our guide to product metrics that matter.
What are the main revenue forecasting methods?
Revenue forecasting methods differ in the data they rely on and the type of uncertainty they are designed to handle. Product teams may use one method for a stable product with years of performance data and another for a new launch with limited evidence. In practice, the strongest revenue forecasts often combine more than one approach.
1. Historical or straight-line forecasting
Historical forecasting uses past revenue performance to estimate future results. A team might take its average monthly growth rate from the previous year and apply that rate to the next quarter.
This method is straightforward and works best when revenue patterns are relatively stable. Its usefulness declines when pricing, market conditions, customer behavior, or the product itself is changing quickly.
2. Moving average and time-series forecasting
Moving averages smooth short-term fluctuations by calculating average revenue across a defined number of previous periods. Time-series models go further by looking for trends, seasonality, and recurring patterns in historical data.
These revenue forecasting models are useful for established products with enough consistent historical data to reveal meaningful patterns.
3. Driver-based forecasting
Driver-based forecasting connects revenue to the variables that directly influence it. For a SaaS product, those drivers might include new customer acquisition, conversion rate, average revenue per account, expansion, and churn.
Because each assumption maps to a measurable business or product signal, this method is particularly useful for product teams trying to understand why expected revenue may rise or fall.
4. Bottom-up forecasting
Bottom-up forecasting builds the revenue forecast from smaller, measurable components. A team might estimate the number of new customers it expects to acquire, multiply that by expected revenue per customer, and then account for expansion and churn.
It works well when teams have reliable customer, pricing, pipeline, or usage data and want a forecast closely tied to operational reality.
5. Top-down forecasting
Top-down forecasting starts with a broader market opportunity and narrows it to the share the company expects to capture.
For example, a team could estimate the addressable market for a new product, define the segment it can realistically reach, and model expected penetration within that segment. This approach can help with early opportunity sizing, although the assumptions need supporting customer and market evidence before they are used for detailed planning.
6. Pipeline-based forecasting
Pipeline-based forecasting estimates future revenue from active sales opportunities. It typically considers deal value, pipeline stage, probability of closing, expected close date, and historical win rates.
This approach is especially relevant for enterprise and sales-led products where a relatively small number of deals can materially affect revenue.
7. Cohort-based forecasting
Cohort forecasting groups customers by a shared characteristic, often the month or quarter in which they joined, and tracks how their behavior changes over time.
Product teams can use cohorts to understand conversion, retention, expansion, and revenue patterns among similar groups of customers. This makes the method valuable for subscription and product-led businesses where customer behavior evolves after acquisition.
8. Regression and statistical forecasting
Regression forecasting analyzes relationships between revenue and one or more variables. A team might study whether changes in active users, marketing spend, pricing, or sales capacity are associated with changes in revenue.
Statistical methods can uncover relationships that are difficult to see manually, but their reliability depends heavily on data quality, sample size, and whether the underlying relationships remain stable.
9. Scenario-based forecasting
Scenario-based forecasting creates several versions of the future based on different assumptions. Product teams commonly build a downside, base, and upside case by varying factors such as adoption, conversion, launch timing, pricing, or churn.
This approach is particularly useful when the forecast depends on uncertain product decisions or customer behavior because it shows a realistic range of outcomes rather than a single estimate.
10. AI and machine learning forecasting
AI and machine learning forecasting uses larger datasets and automated models to identify patterns, relationships, and changes that may be difficult to model manually. Depending on the system, models can incorporate historical revenue, customer behavior, pipeline activity, seasonality, and other signals.
These approaches can support faster analysis and more frequent forecast updates, but their output still depends on the quality of the underlying data and assumptions. Product and finance teams need to understand which inputs are driving the forecast before using it for planning decisions.
How do you choose the right revenue forecasting method?
The right revenue forecasting method depends on the product, the quality of available data, and the decision the forecast needs to support. Product teams should choose a model that reflects how revenue is actually generated and how predictable those drivers are.
Consider the following factors:
- Historical data availability: Products with several years of reliable revenue data can use historical, time-series, or cohort-based methods with greater confidence. Newer products may need to rely more on bottom-up assumptions, market evidence, and scenario planning.
- Revenue model: Subscription, usage-based, transactional, marketplace, and enterprise products behave differently. A subscription product may depend heavily on retention and expansion, while a usage-based product may require forecasts tied to consumption patterns.
- Sales motion: Product-led businesses can often use activation, conversion, and usage data directly. Sales-led businesses usually need pipeline value, win rates, deal size, and sales-cycle timing as core forecasting inputs.
- Product maturity: Mature products tend to have more stable patterns and stronger historical baselines. Early-stage products often require wider forecast ranges because adoption, pricing, and customer behavior are still developing.
- Forecasting horizon: Short-term forecasts can rely more heavily on current pipeline and recent behavior, while annual forecasts need to account for roadmap changes, pricing, market conditions, and longer-term customer trends.
- Measurable customer behavior: When teams can reliably track activation, usage, retention, expansion, and conversion, driver-based and cohort models can provide a more detailed view of future revenue.
- Complexity of the revenue drivers: A single revenue forecasting model may not capture every source of revenue. Teams can combine methods when different parts of the business behave differently.
For more context on how acquisition, activation, retention, and expansion work in this model, read our guide to product-led growth.
A practical way to choose is to start with the revenue model and available evidence:
Product type | Useful revenue forecasting methods | Why they fit |
Established SaaS product | Historical, cohort-based, driver-based, scenario forecasting | Mature subscription products usually have enough data on acquisition, retention, expansion, and churn to model recurring revenue with reasonable confidence. |
Product-led growth business | Driver-based, cohort-based, bottom-up forecasting | Activation, free-to-paid conversion, usage, retention, and expansion provide measurable inputs for building a product revenue forecast. |
Enterprise or sales-led product | Pipeline-based, bottom-up, scenario forecasting | Revenue often depends on a smaller number of higher-value deals, making pipeline stage, win probability, deal size, and timing especially important. |
New product with limited historical data | Bottom-up, top-down, analogous, scenario forecasting | Teams can combine market sizing, comparable products, customer research, pricing assumptions, and expected adoption to create an initial forecast range. |
In many cases, combining methods produces a more useful forecast. An established SaaS company, for example, might use cohort data to forecast retention, pipeline-based forecasting for enterprise deals, and scenario modeling for an upcoming pricing change. The goal is to choose revenue forecasting methods that make the key assumptions visible and easy to update as new evidence becomes available.
How do product teams build a revenue forecast?
Building a useful product revenue forecast starts with a clear decision, a measurable revenue mechanism, and assumptions that can be tested over time. The process should make it easy for Product, Finance, and GTM teams to see where the expected revenue comes from and what would cause the forecast to change.
Here is how to build a revenue forecast for product teams in eight steps.
Step 1: Define the decision and forecasting period
Start by clarifying what the forecast needs to help the team decide. A forecast built to evaluate a pricing change will require different inputs from one used to estimate the revenue contribution of a new enterprise feature or product launch.
Define the time horizon at the same stage. Monthly forecasts can work well for near-term conversion or usage changes, while quarterly forecasts are often more useful for roadmap planning and launches. Annual forecasts are better suited to longer-term investment and portfolio decisions.
The scope should be specific enough that everyone understands what the forecast includes. For example, a team might forecast the revenue impact of a new paid tier over the next two quarters rather than forecasting total company revenue.
If you are connecting forecast assumptions to upcoming initiatives, our guide to product roadmaps vs. backlogs explains how strategic priorities move into execution.
Step 2: Identify the revenue mechanism
Next, define exactly how the product decision is expected to create or protect revenue. This keeps the model tied to a measurable commercial outcome.
Common revenue mechanisms include:
- Acquisition: attracting additional paying customers.
- Conversion: moving more users from free, trial, or evaluation stages into paid plans.
- Expansion: increasing revenue through upgrades, seats, add-ons, or higher usage.
- Retention: reducing churn or improving renewal rates.
- Pricing: changing the amount customers pay or the way plans are packaged.
- Transactions or usage: generating revenue as customer activity increases.
- Deal enablement: unlocking enterprise opportunities that depend on specific capabilities.
A single initiative can affect more than one mechanism. A better onboarding experience, for example, may improve activation first, which can then influence conversion and longer-term retention. Product teams should document each expected link rather than assigning one broad revenue number to the initiative.
Step 3: Establish the current baseline
Before estimating future performance, document what the product is doing today. The baseline gives the forecast a reference point and makes later comparisons meaningful.
Depending on the revenue model, the baseline may include:
- Current MRR or ARR.
- Number of paying customers.
- Average revenue per account or customer.
- New customer growth.
- Trial-to-paid or free-to-paid conversion.
- Activation and adoption rates.
- Expansion revenue.
- Customer and revenue churn.
- Renewal rates.
- Usage or transaction volume.
- Average deal size and sales-cycle length.
Choose the metrics that directly relate to the revenue mechanism identified in the previous step. If the forecast concerns a retention initiative, churn and renewal behavior deserve more attention than top-of-funnel traffic.
Step 4: Gather and validate the required data
Revenue forecasting for product teams usually depends on information spread across several systems. Product analytics can show usage and adoption, CRM data can provide pipeline and deal information, billing systems can show actual revenue, and Finance can provide historical performance and planning assumptions.
Bring those inputs together and check whether they describe the same period, customer population, pricing structure, and revenue definition.
Data quality matters because small inconsistencies can materially change a forecast. For example, combining contracted revenue from one source with recognized revenue from another can create a misleading baseline. Similar problems occur when churn definitions differ between Product, Customer Success, and Finance.
Before modeling future revenue, align on the source of truth for each major input.
Step 5: Define the assumptions and revenue drivers
Once the baseline is clear, identify the variables expected to change. These become the revenue drivers in the model.
For a new product tier, the assumptions might include:
- Percentage of eligible customers expected to upgrade.
- Expected price of the new tier.
- Adoption ramp after launch.
- Expected effect on churn.
- Additional expansion from seat growth.
- Planned launch date.
- Sales or onboarding capacity.
Record where each assumption comes from. Some may come from historical product data, while others may come from customer research, sales conversations, experiments, or comparable launches.
It is also useful to assign a confidence level to important assumptions. A conversion rate observed across several cohorts carries stronger evidence than an adoption estimate based on a small set of interviews. Making that distinction visible helps teams understand where forecast risk is concentrated.
Step 6: Choose the forecasting method
Select the revenue forecasting method that fits the product, data, and level of uncertainty.
An established SaaS product might combine cohort forecasting for retention with driver-based forecasting for acquisition and expansion. An enterprise product may rely more heavily on pipeline-based forecasting. A new product with limited historical data may need bottom-up assumptions supported by market research and scenario analysis.
The method should stay understandable to the people using the forecast. Product managers should be able to trace a change in expected revenue back to the driver or assumption that caused it.
When several revenue streams behave differently, use different methods for each component and combine them into the overall revenue forecast.
Step 7: Build base, upside, and downside scenarios
A single forecast can create more confidence than the evidence supports, especially when product adoption, launch timing, or market response is uncertain. Scenario-based forecasting gives teams a range of plausible outcomes.
A typical model includes:
- Downside scenario: slower adoption, weaker conversion, delayed launch, higher churn, or lower deal volume.
- Base scenario: the outcome supported by the team's current assumptions and available evidence.
- Upside scenario: stronger adoption, faster rollout, better conversion, or higher expansion than the base case.
Keep the differences between scenarios explicit. If the base case assumes a 12% upgrade rate and the upside case assumes 18%, document why each assumption is plausible.
Scenarios become especially valuable when leadership is deciding how much engineering capacity, marketing spend, sales coverage, or infrastructure to commit before the outcome is known.
Step 8: Compare forecasts with actual performance
A revenue forecast should evolve as real results become available. Once a launch goes live or a pricing change takes effect, compare actual performance with what the model predicted.
Look at the variance at the driver level. If revenue came in below forecast, determine whether acquisition was weaker, conversion was lower, customers adopted more slowly, churn increased, or the launch happened later than expected.
Then update the assumptions that changed.
This creates a feedback loop for future forecasts. Over time, the team learns which assumptions tend to be reliable, where estimates regularly drift, and which product signals provide the strongest indication of future revenue.
Teams that follow this process consistently can improve revenue forecast accuracy while also making product planning more evidence-based. The value comes from maintaining a model that reflects the latest customer behavior, roadmap changes, and commercial reality.
How do you forecast revenue for a new product?
Forecasting revenue for a new product is harder because there is little or no historical performance to rely on. Product teams have to build the first forecast from comparable data, customer evidence, pricing assumptions, expected adoption, and a clear view of how quickly demand may develop.
1. Use comparable products or previous launches
Start with products, features, or launches that resemble the new offering. Internal comparisons are usually the most useful because they reflect your customer base, pricing environment, acquisition channels, and sales motion.
Look at factors such as:
- Initial adoption rate.
- Time from launch to meaningful usage.
- Conversion to paid plans.
- Average revenue per customer.
- Expansion after adoption.
- Churn or retention patterns.
External benchmarks can provide additional context when internal comparisons are limited, but they should be adjusted for differences in audience, pricing, distribution, and product maturity.
2. Estimate addressable demand
Market sizing can help establish the potential opportunity, but product teams still need to narrow that opportunity to the customers they can realistically reach and convert.
A useful progression is to estimate:
- The broader addressable market.
- The segment the product is designed to serve.
- The customers the business can realistically reach.
- The proportion likely to adopt and pay within the forecast period.
This produces a more grounded starting point for the revenue projection than applying an arbitrary percentage to a large market estimate.
3. Gather evidence from customers and GTM teams
Early revenue assumptions should be supported by evidence from the people closest to customer demand.
Product teams can use:
- Customer interviews and discovery calls.
- Willingness-to-pay research.
- Feature requests and usage patterns.
- Sales pipeline and lost-deal data.
- Customer Success feedback.
- Existing customer expansion signals.
- Pre-orders, waitlists, or expressions of interest.
Sales can reveal whether the product solves a requirement that affects active deals, while Customer Success can identify existing customers who may adopt or expand into the new offering.
4. Validate assumptions before scaling the forecast
Research should be followed by behavioral evidence wherever possible. Product teams can test key assumptions through prototypes, pricing experiments, beta programs, pilots, limited releases, or controlled rollouts.
For example, if the forecast assumes that 15% of eligible customers will adopt a new paid add-on, an early pilot can reveal whether that assumption is realistic before the team uses it for broader planning.
Focus testing on the assumptions that have the greatest influence on expected revenue.
5. Model the adoption and revenue ramp
New products rarely reach their expected adoption level immediately. Forecast the ramp over time by estimating how quickly customers will discover, evaluate, adopt, and pay for the product.
A revenue ramp may account for:
- Gradual rollout across customer segments.
- Sales-cycle length.
- Onboarding time.
- Product awareness.
- Customer procurement cycles.
- Capacity limits.
- Seasonality.
This is especially important for annual forecasts because moving a launch or delaying adoption by a quarter can materially change the revenue recognized within that year.
6. Build multiple forecast scenarios
Uncertainty is naturally higher when forecasting a new product, so use a range of outcomes.
A downside case might assume slower adoption or a delayed launch. A base case should reflect the assumptions best supported by current evidence. An upside case can model stronger demand, faster adoption, or higher conversion.
Changing a small number of meaningful drivers between scenarios makes it easier to understand what would need to happen for each outcome to occur.
7. Replace assumptions with actual data after launch
The first forecast will contain more assumptions than a forecast for an established product. Once the product launches, begin replacing those assumptions with observed data.
Track actual:
- Adoption and activation.
- Conversion.
- Pricing and plan mix.
- Usage.
- Expansion.
- Retention.
- Sales-cycle length.
- Revenue per customer.
Compare these results with the original forecast and update the model as evidence improves. This turns the initial estimate into a progressively stronger product revenue forecast and gives the team better reference data for future launches.
How do different product decisions affect revenue forecasts?
Product decisions influence revenue through different mechanisms. Forecasting becomes more useful when teams identify which mechanism an initiative is expected to affect and connect it to a measurable change in customer behavior or commercial performance.
1. Acquisition
Some product changes are designed to bring more customers into the paid product. These may include onboarding improvements, stronger activation experiences, integrations, new entry-level features, or changes that improve trial-to-paid conversion.
When forecasting acquisition impact, teams should estimate how the decision could change metrics such as sign-up volume, activation, conversion rate, customer acquisition, and average revenue from newly acquired customers. The timing of the impact matters as well, since adoption usually builds gradually after a release.
2. Expansion
Expansion revenue comes from existing customers spending more over time. Product teams may influence this through additional seats, higher usage, premium capabilities, add-ons, or upgrades to higher plans.
A forecast should identify which customers are eligible to expand, the expected upgrade or adoption rate, and the additional revenue generated per account. Historical upgrade behavior and usage patterns can provide a useful baseline for these assumptions.
3. Retention
Product investments can also protect existing revenue by improving customer retention. Reliability improvements, workflow enhancements, better onboarding, and frequently requested capabilities may influence churn or renewal behavior.
For retention-focused initiatives, teams can model the expected change in customer churn, revenue churn, renewal rate, or contraction. Since retention effects often take longer to appear than acquisition or conversion changes, the forecast period should match the renewal cycle and customer lifecycle.
Customer feedback can add context to churn and renewal signals. See our guide to customer feedback management for product teams for a structured approach.
4. Enterprise deal enablement
Enterprise revenue can depend on specific capabilities such as security controls, compliance requirements, integrations, administration features, or deployment options. Sales teams may already have opportunities where one of these capabilities affects whether a deal can move forward.
Product teams can use qualified pipeline data to estimate the potential revenue associated with the capability. Relevant inputs include deal value, probability of closing, expected close date, the number of opportunities affected, and evidence that the product requirement is genuinely influencing the purchase decision.
5. Pricing and packaging
Changes to price points, plan structure, feature limits, or packaging can affect revenue across acquisition, expansion, and retention.
Forecasting these decisions requires more than applying the new price to every customer. Teams should account for the expected customer mix, migration between plans, discounts, conversion changes, upgrade behavior, and possible churn. Pricing experiments, customer research, and previous packaging changes can help refine these assumptions.
6. Usage or transaction revenue
For usage-based and transactional products, revenue depends directly on customer activity. Relevant drivers may include API calls, compute consumption, transactions, storage, processed volume, or marketplace activity.
A revenue forecast should estimate both the number of active customers and the expected usage or transaction volume per customer. Teams should also account for seasonality, customer growth, pricing tiers, and any limits that could influence consumption.
Mapping each product initiative to its underlying revenue mechanism makes the forecast easier to evaluate and update. It also helps teams distinguish between initiatives expected to generate new revenue, expand existing accounts, or protect revenue that is already at risk.
How should product teams account for uncertainty?
Revenue forecasts depend on assumptions about customer behavior, product delivery, pricing, market conditions, and sales performance. Product teams can make that uncertainty easier to manage by showing which assumptions carry the most risk and how different outcomes would affect expected revenue.
- Build downside, base, and upside scenarios: Model a realistic range of outcomes instead of relying on one number. The downside case can reflect slower adoption, delayed delivery, or weaker conversion. The base case should use the assumptions best supported by current evidence, while the upside case can model stronger demand or faster expansion.
- Document the assumptions behind each forecast: Record the inputs that materially affect expected revenue, such as launch date, adoption rate, conversion, churn, pricing, deal volume, or usage. Clear assumptions make it easier to understand why the forecast changes.
- Assign confidence levels based on evidence quality: Give stronger weight to assumptions supported by historical data, experiments, or observed customer behavior. Assumptions based mainly on interviews, early demand signals, or market estimates should carry lower confidence until more evidence becomes available.
- Account for roadmap and launch timing: Revenue often depends on when a capability ships and how quickly customers can adopt it. A delayed release, phased rollout, or longer onboarding period can shift expected revenue into a later forecasting period.
- Include market, competitive, and customer risks: Changes in customer budgets, competitor pricing, regulation, procurement cycles, or broader market demand can affect revenue even when product execution stays on plan.
- Revisit dependent assumptions when one variable changes: Forecast inputs are often connected. A launch delay may reduce the number of customers exposed to the product, which can then affect adoption, conversion, expansion, and annual revenue. Updating related assumptions together keeps the model internally consistent.
How can product teams improve revenue forecast accuracy?
Revenue forecast accuracy improves as teams build a stronger feedback loop between assumptions and actual performance. The goal is to learn which inputs consistently predict revenue well and where the forecasting model needs adjustment.
- Compare forecasted and actual revenue regularly: Review actual results against the forecast at a consistent cadence. Monthly or quarterly comparisons can reveal whether the model is tracking performance closely enough for planning decisions.
- Investigate the reasons behind forecast variance: Look beyond the size of the gap and identify what caused it. Revenue may have missed the forecast because adoption was slower, conversion changed, churn increased, deals slipped, or a launch moved to a later period.
- Replace assumptions with observed data: Early forecasts may rely heavily on estimates. As customer, usage, conversion, retention, and revenue data becomes available, use those results to replace assumptions and refine future forecasts.
- Improve data quality across Product, Finance, and GTM systems: Forecast accuracy depends on consistent definitions and reliable inputs. Align metrics such as active customers, churn, expansion revenue, pipeline stages, and recognized revenue across the teams contributing to the model.
- Reforecast after material changes: Update the revenue forecast when a major launch is delayed, pricing changes, customer behavior shifts, market conditions move, or another assumption with meaningful revenue impact changes.
- Maintain clear ownership for major assumptions: Assign owners to inputs such as launch timing, pipeline conversion, churn, adoption, or pricing. Clear ownership makes it easier to validate assumptions and keep the forecast current.
- Use rolling forecasts when frequent updates are useful: Rolling forecasts continuously extend the planning horizon as each period closes. They are useful for products where demand, pipeline, usage, or roadmap timing changes frequently and an annual forecast can become outdated quickly.
Improving revenue forecast accuracy is usually less about finding a more complicated model and more about improving the evidence behind it. Teams that review variance, update assumptions, and keep product and commercial data aligned build forecasts that become more reliable over time.
How should Product, Finance, and GTM teams work together on revenue forecasting?
Revenue forecasting works best when each team contributes the inputs it understands most deeply. Product brings customer and roadmap signals, Finance maintains the financial model, and GTM teams contribute demand, pipeline, and retention data.
Team | Primary contribution to the forecast |
Product | Roadmap timing, launch plans, feature adoption, usage trends, pricing inputs, and assumptions about how product changes may influence acquisition, expansion, or retention. |
Finance | Company-level revenue model, historical financial performance, planning assumptions, forecast methodology, and reconciliation between product-level estimates and the broader financial forecast. |
Sales and RevOps | Pipeline value, stage conversion, win rates, average deal size, sales-cycle length, expected close dates, and deal-specific product requirements. |
Marketing | Demand generation, acquisition volume, campaign performance, lead conversion, channel mix, and assumptions about future customer acquisition. |
Customer Success | Renewal likelihood, churn risk, account health, expansion opportunities, downgrade risk, and customer feedback that may affect retention assumptions. |
Leadership | Strategic priorities, investment decisions, planning horizons, growth expectations, and the trade-offs the forecast needs to inform. |
The teams should also agree on shared definitions, data sources, and review cadence. When Product models adoption one way while Finance or RevOps uses a different customer or revenue definition, the forecast can become difficult to reconcile. A shared set of assumptions makes changes easier to trace and gives decision-makers a clearer view of where the forecast is gaining or losing confidence.
Final thoughts
Revenue forecasting gives product teams a structured way to connect roadmap decisions, customer behavior, and commercial outcomes. The strongest forecasts make assumptions visible, use the most relevant product and revenue signals, and evolve as new evidence becomes available.
For product teams, the value comes from using the forecast as an active planning tool. As launches ship, adoption changes, pricing evolves, or customer behavior shifts, the model should change with them. Over time, that feedback loop helps teams make better investment decisions, improve revenue forecast accuracy, and build a clearer shared view of expected business impact.
Frequently asked questions
Q1. What is product revenue forecasting?
Product revenue forecasting is the process of estimating how much revenue a product is likely to generate over a future period. Product teams build forecasts using inputs such as historical revenue, pricing, customer acquisition, conversion, adoption, usage, retention, expansion, sales pipeline, and planned product changes. The forecast helps teams evaluate roadmap decisions and understand their expected commercial impact.
Q2. How do you do revenue forecasting?
To forecast revenue, define the forecasting period, establish the current revenue baseline, identify the main revenue drivers, gather reliable product and financial data, and choose an appropriate forecasting method. Then document the assumptions, build base, upside, and downside scenarios, and compare the forecast with actual performance over time. Updating assumptions as new data becomes available helps improve revenue forecast accuracy.
Q3. What is the difference between revenue forecasting and sales forecasting?
Revenue forecasting estimates the total revenue a business expects to generate, while sales forecasting focuses primarily on expected sales from current and future selling activity. A sales forecast commonly uses pipeline value, deal stages, win rates, and expected close dates. A revenue forecast can also include renewals, expansion, churn, pricing changes, usage-based revenue, and other revenue sources beyond new sales.
Q4. What is a 3-way forecast model?
A 3-way forecast model is an integrated financial forecast that connects the profit and loss statement, balance sheet, and cash flow statement. Changes in one statement flow through to the others, giving businesses a broader view of expected profitability, financial position, and cash movement. Product revenue forecasts may provide inputs to a 3-way model, but the 3-way model covers the company's wider financial position.
Q5. What are the five forecasting methods?
Five common revenue forecasting methods are historical forecasting, time-series forecasting, driver-based forecasting, bottom-up forecasting, and pipeline-based forecasting.
- Historical forecasting projects future revenue from previous performance and growth trends.
- Time-series forecasting analyzes historical patterns, trends, and seasonality over time.
- Driver-based forecasting models revenue using measurable factors such as acquisition, conversion, pricing, retention, or usage.
- Bottom-up forecasting builds expected revenue from customers, units, deals, pricing, or other granular inputs.
- Pipeline-based forecasting estimates revenue from sales opportunities using deal values, stages, close probabilities, and expected timing.
The best forecasting method depends on the product's revenue model, maturity, available data, and sales motion.
Recommended for you



 Download for Mac
 Download for Android