What is cycle time vs. lead time? Key differences for agile teams
Introduction
A feature request moves from idea to backlog, from backlog to execution, and from execution to release, yet each stage tells a different story about delivery performance, as reflected in cycle time vs. lead time. Understanding how to measure cycle time and lead time in Agile teams gives product leaders and engineering teams a clearer view of workflow efficiency, stakeholder wait time, and the real pace of value delivery across modern software projects.
What is lead time in agile?
Lead time in Agile measures the total time between when a request enters the system and when the delivered work reaches stakeholders or users. It captures the full journey of a feature, task, or issue across prioritization, queueing, execution, and release stages. Teams use lead time to understand how quickly value moves through their workflow and how long stakeholders typically wait after raising a request.
Where lead time start
Lead time begins when a request first enters the delivery system. This moment often appears when a feature request is created, a bug is logged, or a task moves into the backlog. From that point onward, every stage, including prioritization, scheduling, and preparation, contributes to the total lead time in Agile workflows.
Where lead time ends
Lead time ends when the requested work becomes available to stakeholders or users. This stage may correspond to release into production, delivery to customers, or completion within an internal workflow, depending on how a team defines delivery. Clear agreement on this endpoint helps teams accurately measure lead time vs. cycle time across projects.
Why lead time matters for agile teams
Lead time reflects how long stakeholders wait between requesting work and receiving value. Shorter lead time improves responsiveness to change, strengthens planning confidence, and supports better release forecasting. Tracking lead time vs. cycle time together also helps teams identify whether delays originate before execution begins or inside active development stages.
What is cycle time in agile?
Cycle time in Agile measures the time required to complete a work item after active execution begins. It captures how long a task stays in the delivery workflow after the team starts working on it. Teams use cycle time in Agile to understand execution speed, monitor workflow stability, and identify delays that affect delivery consistency across features, bug fixes, and improvements.
Where the cycle time starts
Cycle time begins when a work item moves into an active execution stage, such as “In progress.” This transition signals that the team has committed capacity and begun implementation, marking the starting point for accurately measuring cycle time vs. lead time across Agile workflows.
Where cycle time ends
Cycle time ends when the work item reaches completion or delivery readiness. Depending on the workflow definition, this stage may correspond to code completion, review approval, merge readiness, or release preparation, provided the team consistently applies the same endpoint across projects.
Why cycle time matters for agile teams
Cycle time reflects how efficiently work moves through execution stages after development begins. Shorter, more stable cycle times in Agile teams improve forecasting accuracy, support smoother sprint planning, and help teams detect workflow bottlenecks earlier by highlighting delays in review, testing, or coordination stages.
Cycle time vs. lead time: Key differences
Cycle time vs. lead time measure different parts of the same delivery timeline. Lead time tracks how long stakeholders wait from request to delivery, while cycle time measures how long execution takes after work begins. Understanding this distinction helps Agile teams interpret workflow delays more accurately and improve delivery predictability.
1. Lead time includes waiting time
Lead time includes the entire journey of a work item from request to delivery. This timeline captures backlog queue duration, prioritization delays, approval stages, dependency coordination, and scheduling gaps before execution begins. These stages shape stakeholder expectations because they represent the full waiting experience before value reaches users.
For example, a feature request that enters the backlog and waits several days before development begins increases lead time, even if execution is quick afterward. Lead time, therefore, reflects how responsive a system is to incoming work.
2. Cycle time measures active work duration
Cycle time measures only the execution portion of the workflow. The metric begins when a team starts working on an item and continues through implementation, review, testing, and completion stages until delivery readiness.
This makes cycle time in Agile a strong indicator of workflow efficiency within development stages. Changes in review speed, coordination effort, work size, and testing flow directly influence cycle time trends across sprints and releases.
3. Cycle time exists inside lead time
Cycle time forms one segment of the larger lead time timeline. Every work item first enters a queue or backlog, then moves into execution, and finally reaches completion. Lead time captures the entire sequence, while cycle time captures only the execution segment.
Understanding this relationship helps teams interpret delivery metrics correctly. A short cycle time combined with a longer lead time signals backlog congestion or prioritization delays, while similar values across both metrics indicate smooth flow from request to delivery.
4. Lead time reflects customer experience, cycle time reflects team efficiency
Lead time is the time it takes for stakeholders to receive value after submitting a request. Cycle time represents how efficiently teams move work through execution once implementation begins. Together, these metrics connect stakeholder expectations with workflow performance inside Agile delivery systems.
Product leaders often use lead time to evaluate responsiveness and roadmap reliability, while engineering teams use cycle time to improve execution flow and identify coordination friction across delivery stages.
Cycle time vs. lead time: Comparison
Cycle time vs lead time highlights different signals about delivery performance across Agile workflows. A structured comparison helps teams quickly identify which metric to use when analyzing execution speed, stakeholder wait time, and workflow bottlenecks.
Aspect | Lead time in Agile | Cycle time in Agile |
Definition | Total time between request creation and delivery to stakeholders | Time required to complete work after execution begins |
Start point | When a task, issue, or feature enters the backlog or delivery system | When work moves into an active execution state, such as in progress |
End point | When the value reaches users, stakeholders, or production environments | When implementation reaches completion or delivery readiness |
What each metric measures | End-to-end delivery responsiveness across the workflow | Execution efficiency within active development stages |
What each metric excludes | Does not isolate execution-only duration within development stages | Does not include backlog queue time, prioritization delays, or intake waiting time |
Who benefits from tracking it | Product managers, stakeholders, delivery leads, and roadmap owners | Engineering teams, sprint planners, and workflow owners |
When teams should use it | When evaluating customer wait time, release predictability, and planning responsiveness | When improving development flow, identifying bottlenecks, and stabilizing execution speed |
A simple agile example of cycle time vs. lead time
Cycle time vs. lead time becomes easier to understand when viewed through a real workflow timeline. The example below shows how a single feature request moves from intake to delivery and how each metric captures a different portion of that journey.
Consider a product team working on a small improvement request for a dashboard filtering feature.
Step 1: Request created
On Monday morning, a customer success manager logs a request asking for an additional filter option in the reporting dashboard. The request enters the backlog and waits to be prioritized during the next planning discussion.
Step 2: Work started
On Thursday afternoon, the team selects the request during sprint planning and moves the task into the in-progress state. Engineering begins implementation after reviewing the requirements.
Step 3: Work completed
On the following Tuesday, the feature passes testing and becomes available to users as part of a scheduled release.
Now the team can clearly measure both lead time and cycle time.
Lead time calculation: Lead time measures the full duration from request entry to delivery.
- Monday → Tuesday of the following week
- Total lead time: 8 days
This timeline includes backlog waiting time, planning alignment, execution, testing, and release preparation.
Cycle time calculation: Cycle time measures only the execution duration after active work begins.
- Thursday → Tuesday
- Total cycle time: 5 days
This timeline includes implementation, review, testing, and completion stages inside the workflow.
What this example shows
This example highlights the key difference between lead time and cycle time in Agile delivery. The three-day gap between Monday and Thursday reflects queue time before execution begins, which affects lead time while remaining outside cycle time. Teams that monitor both metrics can quickly identify whether delays originate in prioritization stages or inside execution stages, which improves forecasting accuracy and workflow planning across sprints.
Why agile teams should track both metrics
Cycle time vs lead time together provide a complete view of how work moves through an Agile delivery system. Lead time shows how long stakeholders wait for value, while cycle time shows how efficiently teams execute after work begins. Tracking both metrics helps teams interpret delays correctly and improve delivery performance with greater precision.
1. Improve delivery predictability
Tracking lead time in Agile workflows helps teams understand how long requests typically take from intake to delivery, which strengthens release planning and roadmap alignment. Cycle time in Agile supports execution-level forecasting by showing how long similar work items take once development begins. Together, these metrics improve estimation accuracy across sprint planning and longer planning horizons.
2. Identify where delays actually occur
Lead time reveals the delay before execution begins, while cycle time highlights how smoothly work progresses during implementation. Comparing cycle time and lead time allows teams to distinguish prioritization gaps from execution bottlenecks, making workflow improvement efforts more targeted and measurable.
3. Improve stakeholder expectations
Stakeholders evaluate delivery performance by the total time from request to release, making lead time a useful indicator for setting expectations. Cycle time complements this view by helping teams explain how quickly implementation moves after work starts. Using both metrics together creates clearer delivery conversations between product leaders, engineering teams, and business stakeholders.
4. Detect workflow bottlenecks earlier
Cycle time trends highlight slowdowns across execution stages such as review, testing, or coordination, while lead time trends reveal queue buildup before development begins. Monitoring both signals helps teams identify where flow slows across the system and supports earlier corrective action during sprint reviews and delivery planning cycles.
How to measure lead time and cycle time in agile workflows
Measuring cycle time vs. lead time in Agile workflows requires clear workflow definitions and consistent tracking across delivery stages. Teams that standardize how work enters execution and how completion is recorded can use both metrics to improve forecasting accuracy, identify bottlenecks earlier, and strengthen visibility into delivery across projects.
1. Define clear workflow start and end states
Accurate measurement begins with a shared agreement on when work enters the system and when delivery is complete. Lead time in Agile typically starts when a request enters the backlog and ends when value reaches users or stakeholders. Cycle time in Agile begins when work enters an active execution state, such as "in progress," and ends when implementation is complete or when it reaches delivery readiness. Clear boundaries ensure that cycle time vs lead time comparisons remain meaningful across teams.
2. Use consistent workflow statuses
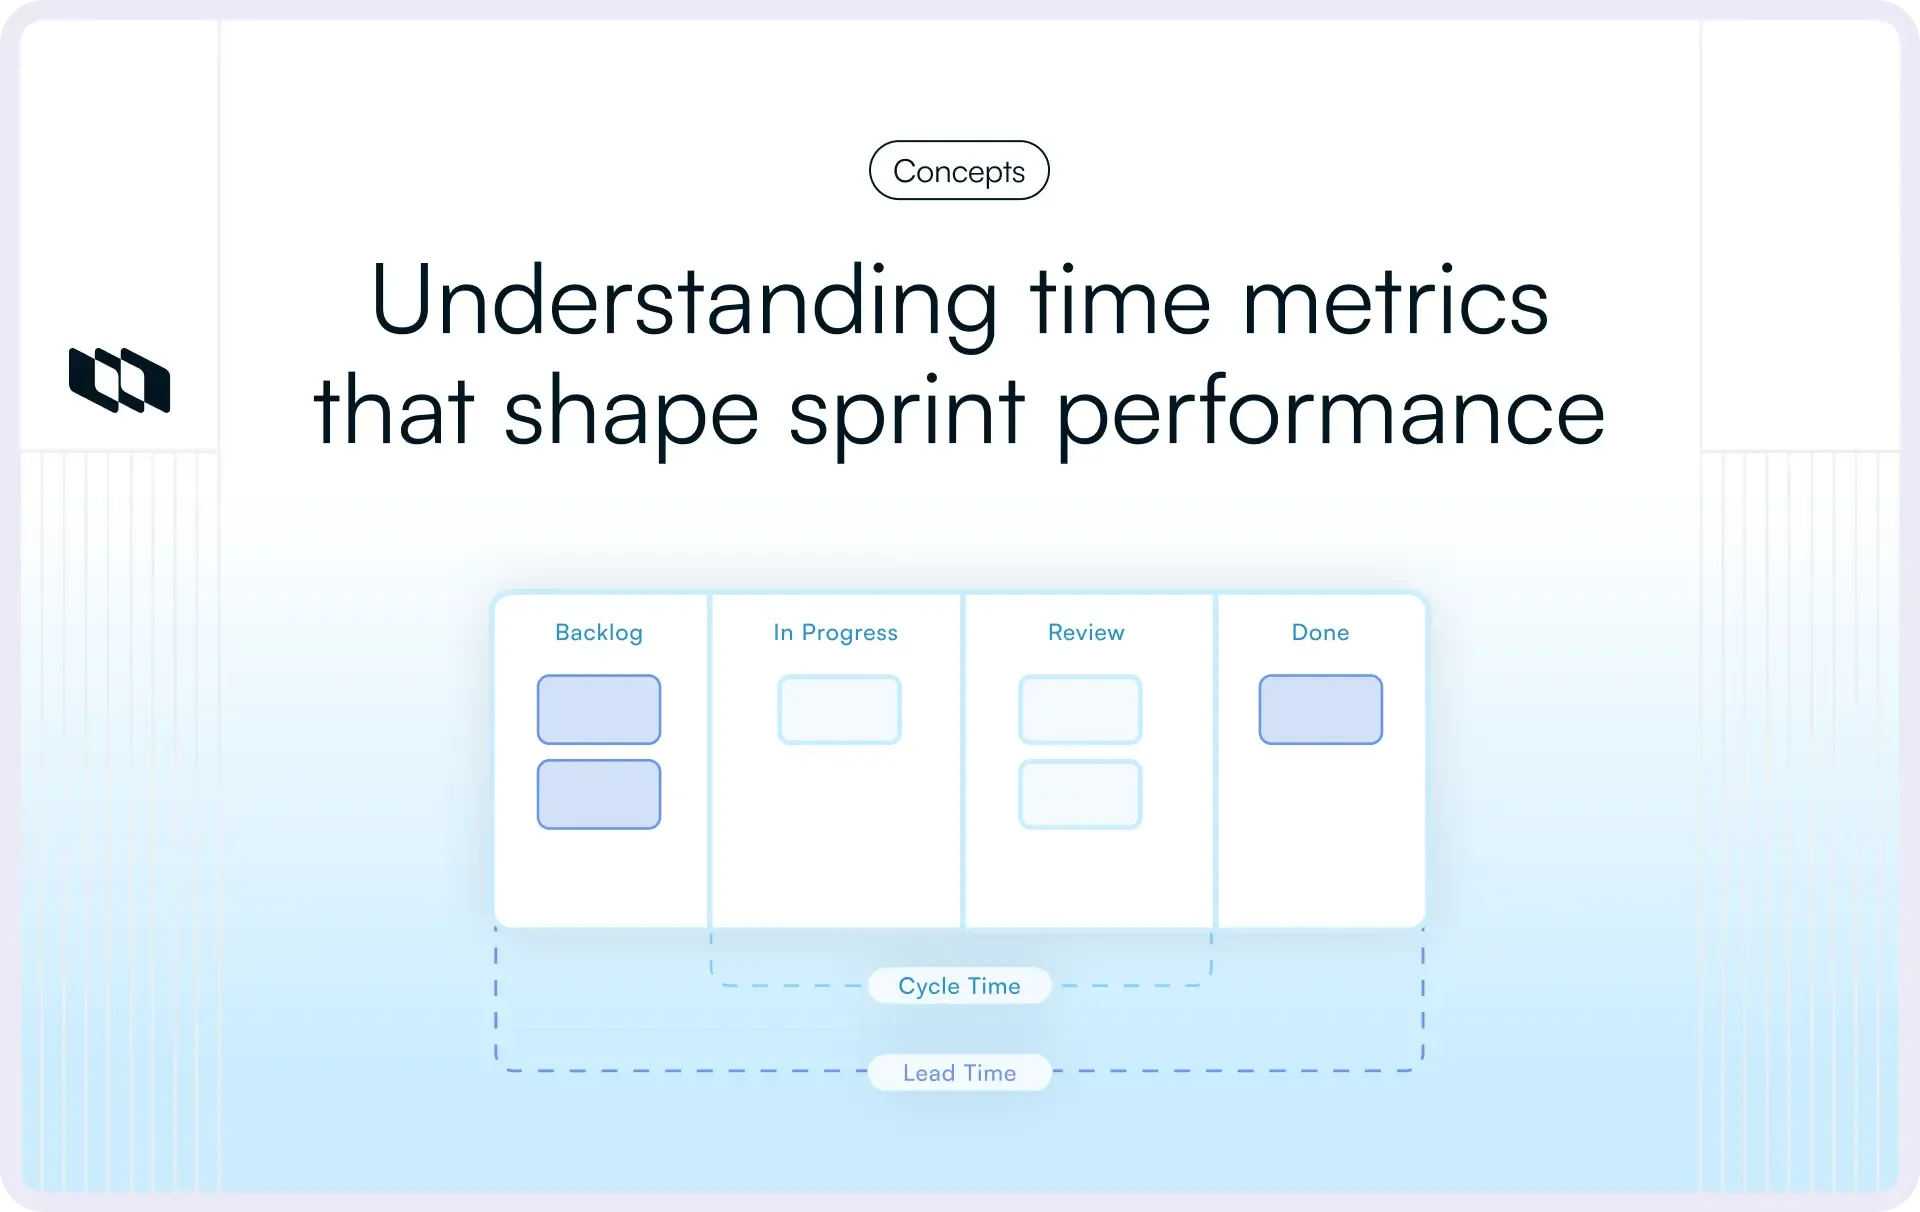
Consistent workflow stages help teams track how work moves through delivery pipelines. A structured sequence, such as backlog → in progress → review → done, allows teams to observe where time accumulates across execution stages and queue transitions. These status definitions make it easier to measure lead time vs cycle time across multiple sprints and projects without introducing ambiguity.
3. Measure trends instead of individual tasks
Individual tasks often vary in complexity, scope, and coordination effort, which makes single measurements less reliable indicators of workflow performance. Teams that analyze cycle time in Agile across multiple work items can identify stable delivery patterns and detect changes in execution speed earlier. Monitoring lead time alongside cycle time helps teams determine whether delays occur before implementation begins or during active development.
4. Review metrics regularly in retrospectives
Regularly reviewing cycle time vs. lead time during sprint retrospectives helps teams connect measurements to improvement decisions. Delivery metrics become more useful when teams discuss workflow slowdowns, review stage transitions, and adjust prioritization strategies based on observed trends. This practice strengthens continuous improvement across Agile delivery environments and supports more predictable release timelines over time.
What long lead time vs. long cycle time reveal about your workflow
Cycle time vs. lead time is most valuable when teams use them as diagnostic signals rather than as reporting metrics. Comparing both timelines helps teams determine whether delivery delays originate before execution begins or during active development, enabling more targeted workflow improvements across Agile environments.
1. Long lead time but short cycle time
A long lead time combined with a short cycle time usually indicates delays before implementation begins. Work items often spend extended periods waiting in backlog queues, prioritization cycles, approval stages, or dependency-alignment discussions before execution starts. In this situation, the development flow remains efficient once work begins, while the intake and scheduling stages slow overall responsiveness to delivery.
Teams that observe this pattern often improve delivery speed by refining backlog readiness criteria, shortening prioritization cycles, and improving visibility across incoming requests. Monitoring lead time vs cycle time together makes these upstream delays easier to detect.
2. Long cycle time and long lead time
A long cycle time, together with a long lead time, usually signals execution-stage friction inside the workflow. Work items may remain in progress longer due to a large scope, unclear requirements, review bottlenecks, coordination gaps between teams, or testing delays. These execution slowdowns extend both timelines simultaneously and affect delivery predictability across sprints.
Reducing work item size, clarifying acceptance criteria earlier, and improving review flow often help stabilize cycle time in Agile environments and shorten overall delivery timelines.
3. Why tracking only one metric creates misleading conclusions
Tracking only lead time shows how long delivery takes from request to release, yet hides whether delays originate in backlog stages or implementation stages. Tracking only cycle time shows execution efficiency after work begins, yet leaves queue time and prioritization delays outside visibility. Observing cycle time vs lead time together gives teams a complete picture of workflow performance and supports better decisions about where improvement efforts create the strongest impact.
Common mistakes teams make when comparing cycle time and lead time
Cycle time vs lead time provides meaningful delivery insights only when teams define and interpret them consistently across workflows. Several common measurement mistakes reduce clarity and weaken forecasting accuracy, especially when teams treat these metrics as reporting indicators rather than improvement signals.
1. Using both terms interchangeably
Cycle time vs lead time measure different stages of the delivery timeline, yet teams often use them as if they describe the same duration. This creates confusion during sprint reviews, roadmap discussions, and release planning conversations because stakeholders and engineering teams begin to interpret delivery speed differently. Clear separation between execution duration and request-to-delivery duration improves reporting accuracy across Agile workflows.
2. Defining inconsistent start and end points
Accurate measurement depends on shared workflow boundaries. When one team measures lead time from backlog entry and another measures it from sprint commitment, comparisons across projects become unreliable. Cycle time in Agile also loses meaning when teams interpret completion differently across the review, testing, or release-readiness stages. Standard definitions ensure cycle time vs lead time remain comparable across workstreams.
3. Ignoring the waiting time outside the execution
Waiting time before implementation begins often shapes the largest portion of delivery timelines. Teams that focus only on execution stages overlook queue buildup, prioritization gaps, and dependency-coordination delays that affect lead time in Agile environments. Including these stages improves visibility into how work actually flows through delivery systems.
4. Comparing metrics across teams with different workflows
Cycle time vs lead time depend heavily on workflow structure. Teams working with different review layers, release cadences, or dependency patterns naturally produce different measurement ranges. Comparing raw numbers across teams without considering workflow context reduces the usefulness of delivery metrics and weakens the accuracy of interpretation.
5. Tracking metrics without improving workflow decisions
Delivery metrics create value when they guide improvement actions across planning and execution stages. Teams that track cycle time vs lead time only for reporting purposes miss opportunities to identify bottlenecks earlier, refine backlog readiness, and stabilize execution flow. Connecting measurement with workflow adjustments strengthens delivery predictability across Agile environments.
How agile teams can improve both lead time and cycle time
Improving cycle time vs lead time requires changes across both intake and execution stages of the workflow. Lead time improves when requests move smoothly from backlog to delivery, while cycle time improves when implementation progresses with fewer interruptions across development stages. Teams that strengthen flow visibility and reduce coordination friction often see measurable improvements across both metrics.
1. Reduce work in progress
High work in progress spreads the team's attention across too many parallel tasks, slowing execution and increasing coordination overhead. Limiting active items helps teams complete work faster and improves flow consistency across delivery stages. Stable work in progress limits support shorter cycle time in Agile workflows and creates smoother transitions between backlog intake and execution.
2. Break large work items into smaller pieces
Large tasks remain longer in progress states because they involve more dependencies, reviews, and testing effort. Smaller work items move through execution stages more quickly, improving predictability across sprints. Teams that regularly split features into incremental deliverables often improve both lead time and cycle time across releases.
3. Remove review and approval bottlenecks
Review stages often introduce hidden delays inside delivery workflows when ownership remains unclear or coordination requires multiple approvals. Streamlining review transitions and clarifying responsibilities among stakeholders helps work items move more consistently through execution stages. Faster review flow supports shorter cycle time in Agile environments and improves overall delivery responsiveness.
4. Clarify requirements before work begins
Clear acceptance criteria and a shared understanding before execution begins reduce mid-implementation changes that slow delivery. Teams that prepare backlog items earlier create smoother transitions into development stages and reduce rework during implementation. Strong backlog readiness improves both cycle time and lead time across planning cycles.
5. Improve workflow visibility with shared boards
Shared workflow boards help teams understand where work accumulates across intake, execution, and release stages. Visibility across dependencies, ownership, and status transitions supports earlier detection of blockers that affect delivery speed. Teams that maintain transparent workflow-tracking systems improve coordination across roles and strengthen delivery predictability in Agile projects.
Final thoughts
Cycle time vs lead time helps Agile teams understand how work moves from request to delivery across the entire workflow. Lead time reflects how long stakeholders wait for value, while cycle time shows how efficiently teams execute once work begins. Tracking both metrics together gives teams a clearer view of delivery performance, workflow stability, and coordination across planning and execution stages.
Teams that consistently measure cycle time vs. lead time can identify where delays accumulate, improve forecasting accuracy, and strengthen alignment between product priorities and engineering execution. Over time, these insights support more predictable releases, faster response to incoming requests, and healthier delivery systems across modern Agile environments.
Frequently asked questions
Q1. How to calculate lead time and cycle time?
Lead time measures the total duration between when a request enters the system and when the value reaches users or stakeholders. Teams calculate lead time by tracking the time from backlog entry to release or delivery.
Cycle time measures the duration from the start of active execution to the completion of work. Teams calculate cycle time by tracking the time from when a task enters an in-progress state to when it becomes delivery-ready. Comparing cycle time vs lead time helps teams identify whether delays occur before implementation or during execution.
Q2. What is the difference between cycle time and process time?
Cycle time is the total duration required to complete a work item from the start of execution, including review stages, testing transitions, and coordination steps within the workflow. Process time represents only the time spent actively working on the task, excluding waiting time between stages.
Teams that track both measurements gain deeper insight into how work moves across execution stages and where time accumulates inside delivery pipelines.
Q3. What does cycle time mean?
Cycle time in Agile describes how long a work item takes to move from active execution to completion. It reflects execution speed across development stages, including implementation, review, testing, and release preparation. Monitoring cycle time helps teams improve workflow stability and detect delivery bottlenecks earlier across projects.
Q4. What is the difference between cycle time, takt time, and lead time?
Cycle time measures how long execution takes after work begins. Lead time measures the total duration from request creation to delivery. Takt time represents the pace at which teams must complete work to match incoming demand.
Together, these metrics help teams understand execution efficiency, stakeholder wait time, and delivery capacity across Agile workflows.
Q5. What is 1 cycle time?
One cycle time represents the total execution duration required to complete a single work item after development begins. For example, if a feature moves into progress on Monday and reaches completion on Thursday, the cycle time for that item equals four days. Tracking cycle time across multiple items helps teams identify delivery patterns and improve forecasting accuracy.
Recommended for you