What is a product metrics framework?
Introduction
A product can gain new users every week while struggling to retain them. Tracking sign-ups, engagement, and revenue separately tells teams what is happening, but understanding how these metrics connect is what makes the data useful. A product metrics framework organizes these measurements around specific product goals, helping teams evaluate performance, identify gaps, and prioritize improvements.
This guide explores the key components, commonly used frameworks, and how to build a measurement approach that connects product performance to meaningful outcomes.
Why is a product metrics framework important?
Product teams often get swamped with data. There’s much to look at, so it’s hard to know what actually matters. A product metrics framework helps sort through the noise. It tells teams which numbers to pay attention to how those numbers tie into the picture of what the product is trying to achieve, and what to check when things go up or down.
Here are six reasons why this matters:
- Aligns metrics with product goals: A framework links daily work to long-term goals. For example if the team is trying to keep users coming they can focus on how often users log in and how engaged they are. They don’t have to treat every sign-up as a win because they know what really drives lasting value.
- Creates measurement: When everyone uses the definitions the same formulas and the same time frames it’s easier to talk about performance. Product managers, engineers, designers and business folks all see the numbers the same way. That cuts down on confusion and arguments over what the data means.
- Improves product prioritization: When teams know which metrics drive success, they can spot what’s worth fixing. If most new users drop off during onboarding but those who finish it stay active then improving the onboarding flow becomes a priority.
- Supports data-driven decisions: Before launching a feature or testing a change, teams can set clear success criteria. Then after the launch they can compare results to what they expected or to a control group. This makes it easier to say, "Yes this change worked" or "No we need to try something ”
- Identifies performance gaps: Breaking goals into smaller trackable metrics helps find where users get stuck. For instance if a new feature gets lots of use but people stop using it after a few days that’s a red flag. Maybe the feature isn’t helpful enough. It’s hard to use after the first time.
- Tracks progress over time: With consistent tracking teams can see if improvements are lasting or just temporary. They can compare today’s numbers to month’s or, to goals they set. This helps them know when to keep pushing in the direction or when to shift focus.
What are the key components of a product metrics framework?
A product measurement framework needs a clear connection between what the product is trying to achieve, which user behaviors influence that outcome, and how progress will be measured. Six components establish this structure:
- Product objectives: Define the customer or business outcomes the team wants to achieve, such as improving customer retention, increasing feature adoption, or reducing time to value. Each objective should be specific enough to guide metric selection.
- Primary success metric: Identify the main indicator of progress toward the objective. This could be a North Star Metric or a focused KPI, such as the percentage of customer accounts retained after 30 days. It gives teams a consistent measure of success.
- Input and driver metrics: Track the behaviors that may contribute to the primary outcome. For a collaboration platform, onboarding completion, teammate invitations, and recurring collaborative activity could be potential drivers of retention. These relationships should be validated through product analysis.
- Outcome metrics: Measure the results of product performance and improvements. These include retention, conversion, expansion revenue, and other indicators of customer or business value. The primary success metric is typically one of these outcomes, while additional outcome metrics provide broader context.
- Guardrail metrics: Monitor potential negative effects of product changes. For example, an increase in feature usage may be less valuable if error rates, loading times, or support requests increase alongside it. Guardrails help teams evaluate these trade-offs.
- Measurement definitions and ownership: Establish how each metric is calculated, where its data comes from, who maintains it, and how frequently it is reviewed. Consistent definitions, baselines, and reporting responsibilities make performance comparisons more reliable.
How do these components work together?
A metrics hierarchy connects the product objective to its primary success metric and the supporting indicators beneath it. Input metrics often serve as leading indicators of potential changes, while outcomes such as retention and revenue are generally lagging indicators that take longer to materialize. Guardrails are monitored alongside this hierarchy.
For example, a collaboration platform aiming to improve customer retention might use 30-day account retention as its primary metric, monitor onboarding completion and weekly collaborative activity as potential drivers, and track application error rates as a guardrail.
This structure helps the team investigate whether changes in early product engagement are followed by improvements in retention, while keeping product reliability in view.
What are the different types of product metrics frameworks?
Different product metrics frameworks help teams evaluate specific aspects of product performance, from customer acquisition and retention to user experience and long-term value. Some provide a comprehensive measurement structure, while others help teams focus on particular goals or translate objectives into measurable indicators.
The following comparison highlights five commonly used approaches.
Framework | Primary focus | Best suited for | Key consideration |
AARRR (Pirate Metrics) | Customer lifecycle and growth | Acquisition, conversion, and retention analysis | Limited insight into the quality of user experiences |
HEART | User experience and product quality | UX improvements and feature evaluation | Requires carefully defined signals and, often, qualitative feedback |
North Star Framework | Recurring customer value | Long-term product alignment and growth | Depends on selecting a meaningful value-based metric |
One Metric That Matters (OMTM) | Immediate measurement priority | Early-stage products and focused improvement efforts | Focus metric changes as priorities evolve |
Goals–Signals–Metrics (GSM) | Translating goals into measurable indicators | UX evaluation and goal-based measurement | Complements broader frameworks rather than replacing them |
1. AARRR (Pirate Metrics) framework
Developed by Dave McClure, the AARRR framework organizes product performance into five stages of the customer lifecycle. It helps teams understand how users discover a product, experience its value, continue using it, recommend it, and generate revenue.
The five stages are:
- Acquisition: How users discover and enter the product, measured through website visitors, sign-ups, or acquisition channels.
- Activation: Whether new users experience initial value, measured through onboarding completion or successful first-time use of a core feature.
- Retention: Whether users continue returning and engaging, measured through repeat usage or cohort retention rates.
- Referral: Whether existing users bring others to the product, measured through invitations or successful referrals.
- Revenue: How product usage generates income, measured through paid conversions, subscriptions, or expansion revenue.
For example, a SaaS platform might track trial registrations for acquisition, first project creation for activation, weekly active accounts for retention, successful team invitations for referral, and trial-to-paid conversion for revenue.
By comparing performance across these stages, teams can identify where users drop off and prioritize improvements. AARRR is particularly useful for growth-oriented products, although teams may need additional UX metrics to understand why users struggle within specific workflows.
2. HEART framework
The HEART framework, developed by researchers at Google, measures user experience through five dimensions. It helps product teams evaluate how users perceive and interact with a product, particularly when assessing usability and feature improvements.
Its five dimensions are:
- Happiness: User satisfaction and perceived product quality, measured through surveys or satisfaction ratings.
- Engagement: The frequency or depth of meaningful user interaction with the product.
- Adoption: How many users begin using a product or feature.
- Retention: Whether users continue using the product or feature over time.
- Task success: How effectively users complete intended actions, measured through completion rates, errors, or time taken.
Consider a collaboration platform introducing a reporting feature. The team could measure adoption through first-time report creation, task success through successful report completion, and happiness through user feedback.
HEART works well when teams need to assess experience quality alongside behavioral performance. However, selecting relevant dimensions and collecting reliable satisfaction data requires deliberate measurement planning.
3. North Star Framework
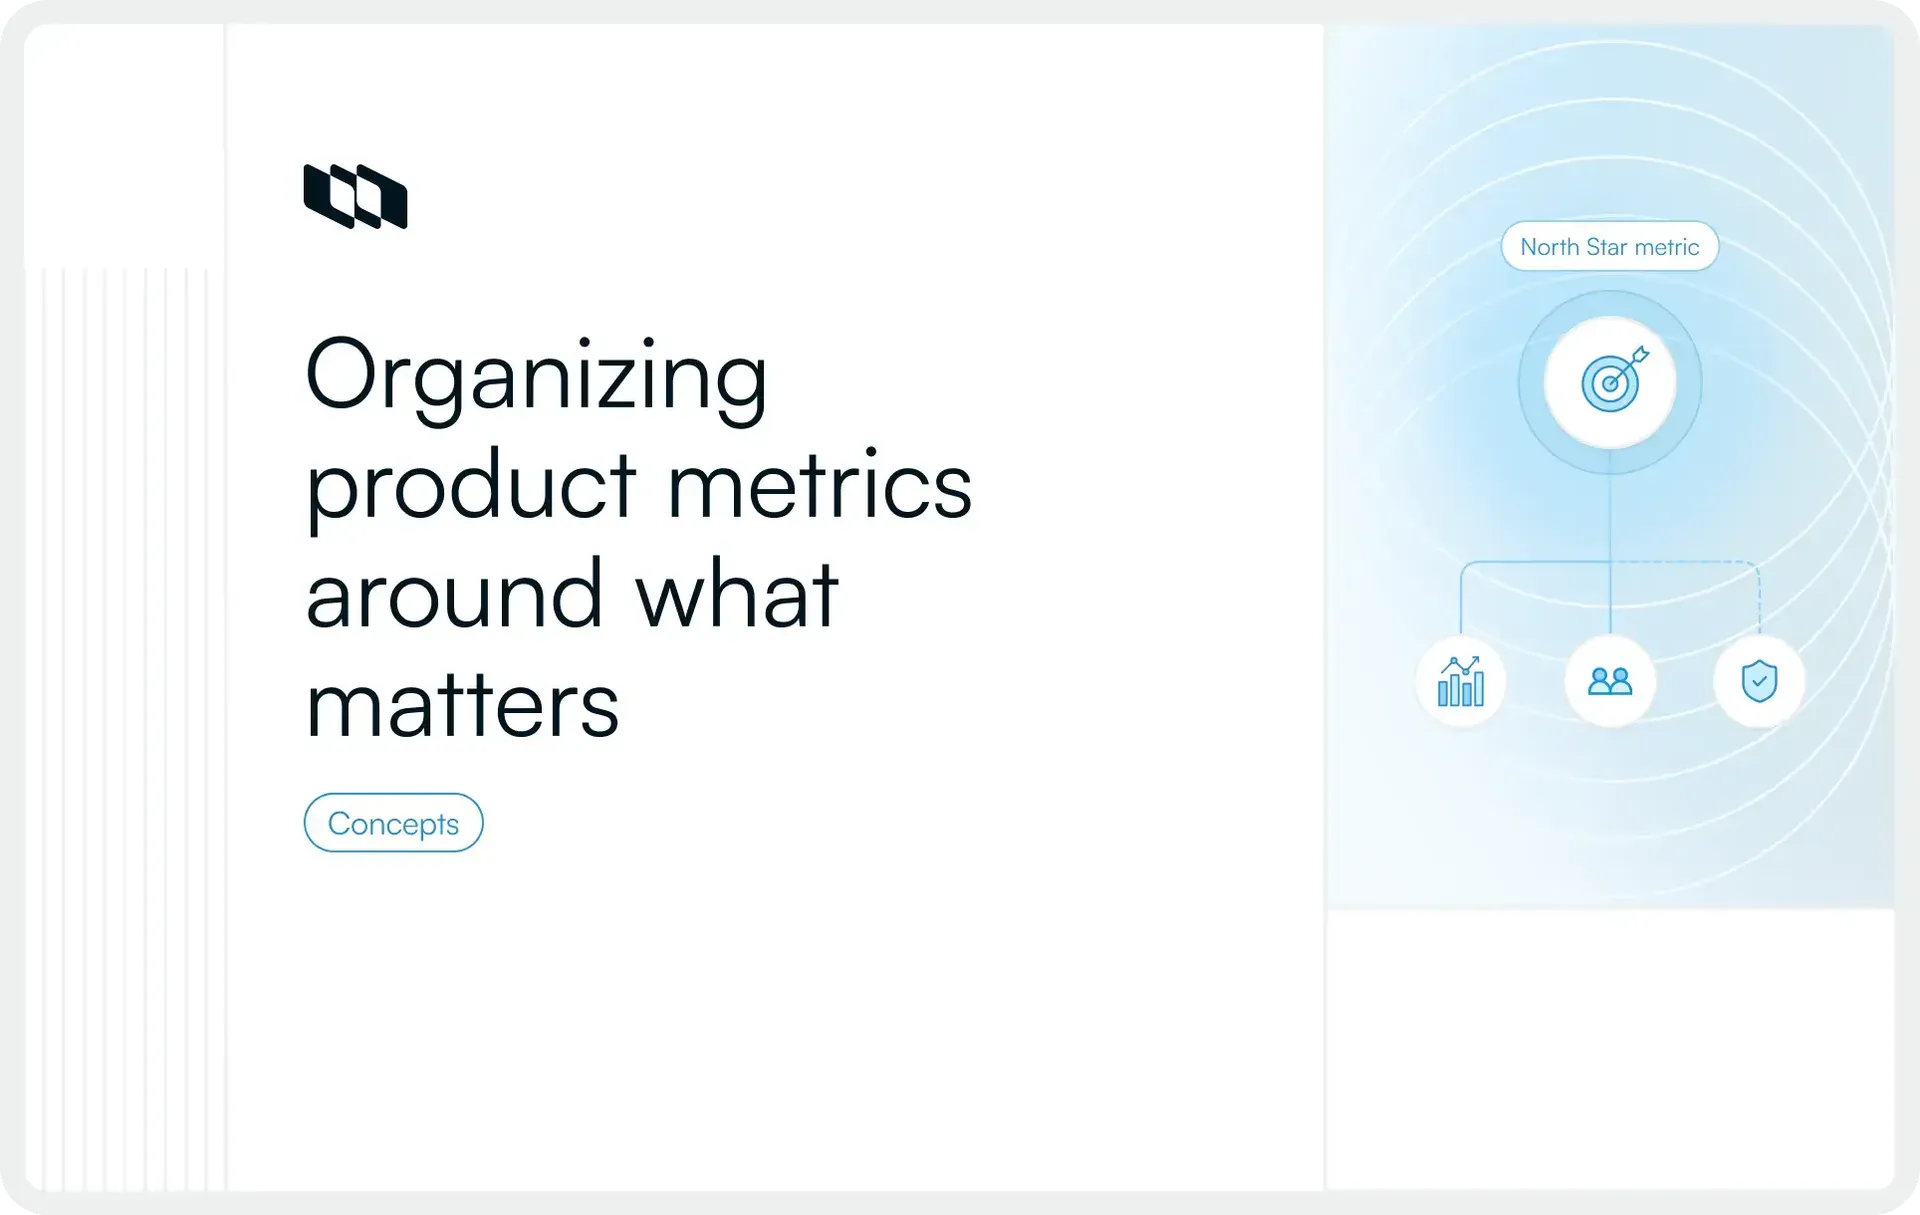
The North Star Framework organizes product measurement around a single metric representing the core value customers receive from a product. Supporting input metrics help teams understand which behaviors and product improvements contribute to that outcome.
For example, a collaboration platform might choose weekly teams successfully completing collaborative workflows as its North Star Metric. Supporting inputs could include team activation, active collaborators, and successful workflow completion.
This structure gives product, engineering, and growth teams a shared outcome while allowing each team to focus on different contributing factors.
The framework is especially useful for long-term product alignment. Its effectiveness depends on choosing a metric that genuinely reflects customer value and has a credible relationship with business performance. Higher activity alone may provide an incomplete picture.
For a detailed explanation of selecting and implementing this metric, see our guide on how product teams define a North Star Metric.
4. One Metric That Matters (OMTM) approach
The One Metric That Matters (OMTM) approach, introduced in Lean Analytics by Alistair Croll and Benjamin Yoskovitz, encourages teams to concentrate on the most important measurement for their current business challenge.
The selected metric changes as the product evolves. For instance, an early-stage SaaS company struggling to demonstrate initial value might prioritize activation rate. Once activation improves, the team may shift its focus to customer retention to determine whether users continue finding value.
OMTM differs from the North Star Framework in its time horizon. A North Star represents an enduring measure of customer value, while OMTM directs attention toward the most pressing current priority.
This approach is useful for maintaining focus during specific growth stages or improvement initiatives. Teams still need supporting metrics and guardrails to understand the broader impact of their decisions.
5. Goals–Signals–Metrics (GSM) approach
Goals–Signals–Metrics (GSM) is a measurement approach described alongside Google's HEART framework. It helps teams turn broad product or UX objectives into observable evidence and quantitative indicators.
It follows three elements:
- Goals: Define what the team wants users to achieve or experience.
- Signals: Identify observable behaviors or feedback that would indicate progress toward the goal.
- Metrics: Convert those signals into measurable indicators that can be tracked consistently.
Suppose a SaaS team wants to improve onboarding. Its goal is to help new users reach their first useful outcome more efficiently. A relevant signal might be users completing their initial project setup, measured through setup completion rate and time to completion.
GSM is particularly useful when teams have clear objectives but need help determining what to measure. It can complement HEART by turning selected UX dimensions into actionable metrics, or support a broader product measurement framework by establishing measurable success criteria.
How do you choose the right product metrics framework?
Choosing a product metrics framework depends on what the team needs to understand about product performance. A framework designed to analyze customer acquisition may offer limited insight into usability problems, while a customer-value-focused approach may need additional metrics to explain conversion bottlenecks. The right choice should reflect the product's goals, business model, and available data.
Consider these six factors when selecting a framework:
1. Define the primary product objective
Start with the outcome the team wants to improve. If users abandon the product during onboarding, AARRR can help examine activation and subsequent retention. If users struggle to complete important tasks, HEART provides a more relevant structure for evaluating their experience.
2. Consider product maturity
Early-stage products often prioritize validating activation and initial retention, while growing products may focus on conversion, engagement, and expansion. Established products typically need a broader view of customer value and performance across different user segments. Choose a framework that supports the decisions most relevant to the current stage.
3. Understand the business model
Different products require different units of measurement. B2B SaaS teams may prioritize account-level adoption and retention, while consumer applications often examine individual user engagement. Marketplaces need visibility into activity on both sides of a transaction, and subscription products must account for renewals and recurring revenue. These differences influence which metrics belong in the framework.
4. Evaluate the user journey
Identify the actions through which customers discover, adopt, and receive value from the product. For a collaboration platform, completing the first project may indicate activation, while recurring teamwork provides a stronger signal of continued adoption. Mapping these behaviors helps determine which framework captures the most relevant stages and outcomes.
5. Assess data availability
Check whether the required user events, account data, transaction records, and customer feedback are available and reliable. A framework that depends on metrics the team cannot consistently calculate will be difficult to maintain. Identify tracking gaps and establish measurement definitions before committing to an approach.
6. Determine whether approaches should be combined
Teams can combine complementary methods to answer different questions. For example, AARRR can identify where users leave the customer journey, while HEART helps investigate usability problems contributing to that behavior. Combining approaches works best when each serves a defined purpose and shares consistent metric definitions.
The following table summarizes which approach fits common product measurement priorities:
Product measurement priority | Suitable approach |
Understand acquisition, activation, and growth | AARRR |
Improve user experience and usability | HEART |
Align teams around delivered customer value | North Star Framework |
Focus on one immediate product priority | One Metric That Matters (OMTM) |
Translate product goals into measurable evidence | Goals–Signals–Metrics (GSM) |
These approaches can work together as a product's measurement needs evolve. The deciding factor is whether the chosen framework helps teams interpret performance and make better product decisions.
How do you build a product metrics framework? A step-by-step guide
Building a product metrics framework starts with identifying the outcomes your team wants to improve and determining which measurements can explain progress toward them. The process involves selecting an appropriate framework, defining success criteria, establishing reliable tracking, and using the results to guide product decisions.
Here are seven steps to create a product metrics framework.
Step 1. Define your product goals
Start with a specific customer or business outcome that supports your product strategy. A goal such as "increase engagement" leaves too much room for interpretation, while "increase sustained adoption of our new reporting feature" establishes a clearer measurement priority.
Identify the target users, the behavior you want to encourage, and the period over which success should be evaluated. This gives subsequent metric selection a defined purpose.
Step 2. Choose the appropriate measurement approach
Select a framework based on the questions your team needs to answer. AARRR can help identify where users drop off during acquisition and activation, while HEART is useful for evaluating feature usability and adoption. The North Star Framework connects ongoing customer value with supporting product behaviors.
For the reporting feature, the team could use HEART's adoption and task-success dimensions to evaluate initial usage and combine them with a longer-term measure of recurring value.
Step 3. Identify your primary success metric
Choose one metric that directly represents progress toward your objective. It should have a clear definition, a consistent measurement period, and enough relevance to influence product decisions.
For sustained reporting adoption, the team might measure the percentage of eligible customer accounts that share a report in at least two separate weeks during their first 30 days of access. This captures recurring behavior rather than relying exclusively on initial feature activation.
Step 4. Define supporting and driver metrics
Break the primary outcome into measurable behaviors that could influence it. Organize these into a metric tree, placing the primary metric at the top and supporting indicators beneath it.
For the reporting example, potential drivers include:
- First report creation rate: Percentage of eligible accounts that create their first report.
- Report sharing rate: Percentage of accounts that successfully share a report.
- Repeat usage rate: Percentage of activated accounts that return to reporting in a subsequent week.
These metrics provide earlier signals of adoption, while the primary outcome requires a longer observation period. Treat relationships between drivers and outcomes as hypotheses to investigate through cohort analysis and experiments.
Step 5. Establish guardrail metrics
Identify what could deteriorate while the team works to improve its primary metric. Guardrails help assess whether higher adoption comes with unacceptable costs to product quality or customer experience.
For example, increased reporting activity should be evaluated alongside report-generation errors, loading times, and support requests related to the feature. Define acceptable thresholds so the team can investigate potential trade-offs before expanding a rollout.
Step 6. Set baselines, targets, and measurement ownership
Establish the current performance level before setting improvement targets. For a newly launched feature, an initial pilot or completed user cohort can provide the first baseline. Targets should reflect observed performance, strategic priorities, and realistic improvement opportunities.
Document the following for each metric:
- Definition: Calculation, eligible population, and measurement window.
- Data source: Tracking events, analytics reports, or customer feedback.
- Target: Expected performance and the period for achieving it.
- Owner: Person responsible for metric quality, reporting, and interpretation.
For instance, the product manager might own the adoption target, while an analytics specialist validates calculations and engineering maintains event instrumentation.
Step 7. Monitor, review, and refine the framework
Set a review cadence that reflects how quickly each metric can produce meaningful results. Teams might examine report-generation failures daily, review activation and sharing trends weekly, and assess 30-day adoption once cohorts have completed the observation period.
Compare results against baselines and targets, investigate differences across customer segments, and document decisions arising from the findings. If initial activation improves but recurring usage remains unchanged, the team can investigate whether customers find enough ongoing value in the feature.
As product objectives evolve, revisit the selected metrics, their assumed relationships, and the decisions they support. This keeps the product metrics framework relevant to the team's current priorities.
What is an example of a product metrics framework in practice?
Consider Latticebay, a fictional B2B collaboration platform that recently introduced shared reports. Customers can create reports, share them with teammates, and revisit them during ongoing projects.
The product team wants to understand whether customers are incorporating reporting into their regular workflows. To measure this, they build a product metrics framework around sustained feature adoption.
Example: Latticebay's shared reporting metrics framework
Component | Metric or objective | Measurement ownership |
Product objective | Increase sustained adoption of shared reports | Product team |
Primary success metric | Percentage of eligible accounts sharing reports in at least two separate weeks within their first 30 days of access | Product manager, reviewed monthly |
Input metrics | First report creation rate, first successful share rate, and collaborator participation rate | Product and analytics teams, reviewed weekly |
Supporting outcome | Continued reporting activity and account retention over subsequent months | Product and customer success teams, reviewed monthly |
Guardrail metrics | Report-generation failures, loading performance, and usability feedback | Engineering and design teams, reviewed regularly |
The primary metric measures recurring behavior at the account level, reflecting how a collaboration product delivers value across teams. Supporting metrics help explain where adoption progresses or slows down.
How does the framework help identify problems?
Suppose Latticebay evaluates a hypothetical cohort of 100 eligible accounts that have completed their first 30 days with the feature:
- 60 accounts create their first report.
- 48 accounts successfully share a report.
- 32 accounts have at least one teammate interact with a shared report.
- 18 accounts share reports in two different weeks.
These illustrative results suggest that customers are exploring the feature, but fewer are returning to use it regularly. The team can investigate whether recipients find the reports useful, whether customers can easily reuse existing reports, or whether sharing introduces unnecessary friction.
Rather than immediately building additional reporting capabilities, the team could interview customers who stopped after their first share and examine where repeat usage declines. Based on those findings, it might test reusable report templates or improvements to report-sharing workflows, then compare recurring adoption across subsequent cohorts.
How would other frameworks evaluate the same feature?
The measurement approach changes depending on the team's priorities:
- AARRR: Examines first successful report sharing as an activation milestone and recurring reporting activity as a retention indicator.
- HEART: Evaluates report adoption, task completion, usability feedback, and continued engagement to understand the quality of the reporting experience.
This product metrics framework example shows how a shared objective, supporting indicators, and guardrails can help teams move from observing feature usage to investigating specific problems and evaluating improvements.
How do product teams use metrics frameworks to improve product decisions?
Once a product metrics framework is established, its value comes from how teams use the findings. Regular analysis helps product managers understand performance changes, investigate potential causes, and decide where to direct engineering and design efforts.
1. Monitor product performance
Use shared dashboards to track primary success metrics alongside supporting indicators and guardrails. Reviewing these measurements together helps teams understand whether progress toward a product goal is consistent or whether certain aspects of performance require attention.
2. Identify trends and bottlenecks
Analyze conversion funnels, behavioral cohorts, and usage patterns to locate friction in the customer journey. For example, if activation increases while 30-day retention declines, comparing cohorts and their subsequent activity can help identify where users disengage.
3. Evaluate product initiatives
Define measurable success criteria before introducing a feature or workflow improvement. Compare results against historical baselines and use controlled experiments where feasible to determine whether observed changes can reasonably be attributed to the initiative.
4. Prioritize improvements
Translate findings into specific product opportunities. If customers frequently create reports but rarely return to them, the team might investigate report discoverability or recurring workflow needs before committing engineering resources. Consider potential impact, confidence in the evidence, and implementation effort when prioritizing the backlog.
5. Review product outcomes
Assess whether completed initiatives produced meaningful improvements in customer behavior and business performance. Examine both the intended outcome and relevant guardrails, then use the findings to inform subsequent product decisions and refine priorities.
What are the common mistakes to avoid when using a product metrics framework?
Even a well-designed product metrics framework can produce misleading insights when teams select the wrong indicators, overlook data quality, or fail to adapt their measurement approach. Avoiding these six mistakes helps keep the framework reliable and useful for product decisions.
1. Tracking too many metrics
Tracking every available metric can make it difficult to identify which changes deserve attention. Teams may spend more time reviewing dashboards than investigating meaningful performance trends.
How to avoid it: Establish a small set of priority metrics tied to specific objectives. Keep supporting diagnostic metrics available for deeper analysis when needed.
2. Relying on vanity metrics
Metrics such as total registrations, page views, or cumulative downloads can indicate reach, but they offer limited insight into whether customers receive lasting value. Strong acquisition numbers, for example, may conceal weak activation or retention.
How to avoid it: Pair growth metrics with indicators of meaningful product usage, such as successful onboarding, recurring activity, or cohort retention.
3. Choosing metrics without clear objectives
Selecting metrics because they are readily available can shift attention away from the outcomes the product team needs to improve. A team focused on retention gains little direction from tracking feature launches or total sign-ups alone.
How to avoid it: Define the product objective first, then select metrics that directly measure progress or help explain the behaviors influencing that outcome.
4. Ignoring supporting and guardrail metrics
A primary metric may improve while other aspects of product performance deteriorate. For example, increasing feature engagement could coincide with slower response times or higher error rates.
How to avoid it: Monitor relevant driver metrics and guardrails alongside the primary outcome. Investigate whether improvements are sustainable and whether they introduce unacceptable trade-offs.
5. Using inconsistent or unreliable data
Different event definitions, incomplete instrumentation, or mismatched reporting periods can produce conflicting results. If teams calculate active accounts differently, performance comparisons become difficult to interpret.
How to avoid it: Document metric definitions, validate tracking events, and standardize calculation methods across reporting systems. Assign clear ownership for maintaining data quality.
6. Failing to revisit the framework
Measurement priorities change as products mature, customer behavior evolves, and business objectives shift. Metrics selected during an initial launch may become less useful once the product reaches broader adoption.
How to avoid it: Review the framework during product planning cycles. Reassess whether the primary metric, supporting indicators, and targets still reflect current objectives, and update them when the evidence or strategy warrants a change.
Final thoughts
A well-structured product metrics framework helps teams understand what drives product performance and where improvements can make a meaningful difference. Its effectiveness depends on choosing metrics that reflect customer value, maintaining consistent measurement practices, and revisiting priorities as the product evolves.
The next step is turning those insights into action. Plane helps product and engineering teams organize priorities, coordinate initiatives, and manage execution around shared goals. Talk to sales to explore how Plane can support your product planning and delivery workflows.
Frequently asked questions
Q1. What is an example of a product metrics framework?
A SaaS company aiming to improve customer retention might use 30-day account retention as its primary metric, supported by onboarding completion, feature adoption, and recurring usage rates. Guardrail metrics, such as application error rates and customer satisfaction, help the team evaluate whether improvements affect product quality.
Q2. What are the most commonly used product metrics frameworks?
Common product metrics frameworks include AARRR (Pirate Metrics) for customer lifecycle measurement, HEART for user experience evaluation, and the North Star Framework for measuring customer value. Teams also use complementary approaches such as One Metric That Matters (OMTM) for short-term focus and Goals–Signals–Metrics (GSM) for translating objectives into measurable indicators.
Q3. What is the difference between a product metrics framework and a KPI?
A product metrics framework is a structured system for selecting, organizing, and interpreting performance measurements. A key performance indicator (KPI) is an individual metric used to evaluate progress toward a specific objective. A framework typically includes several KPIs and supporting metrics to provide a broader understanding of product performance.
Q4. Can product teams use more than one metrics framework?
Yes. Product teams can combine complementary frameworks to address different measurement needs. For example, AARRR can help identify customer lifecycle bottlenecks, while HEART evaluates usability and user satisfaction. Each framework should serve a clear purpose, with consistent metric definitions to avoid redundant tracking.
Q5. How often should a product metrics framework be reviewed?
Review frequency depends on product maturity, measurement periods, and decision-making needs. Teams may monitor operational indicators daily, evaluate activation and engagement weekly, and assess retention or revenue monthly or quarterly. The overall framework should also be reassessed during product planning cycles or whenever strategic priorities change.
Recommended for you





 Download for Mac
 Download for Android
