Introducing PQL and enhanced dashboards
A new way to explore work in Plane with PQL, enhanced dashboards, and interactive analytics.
A new way to explore work in Plane with PQL, enhanced dashboards, and interactive analytics.
A query language for work items, an AI that writes queries from plain English, the same query language inside dashboards, a redesigned dashboard surface, and interactive charts you can compose without leaving the page.
What's shipping
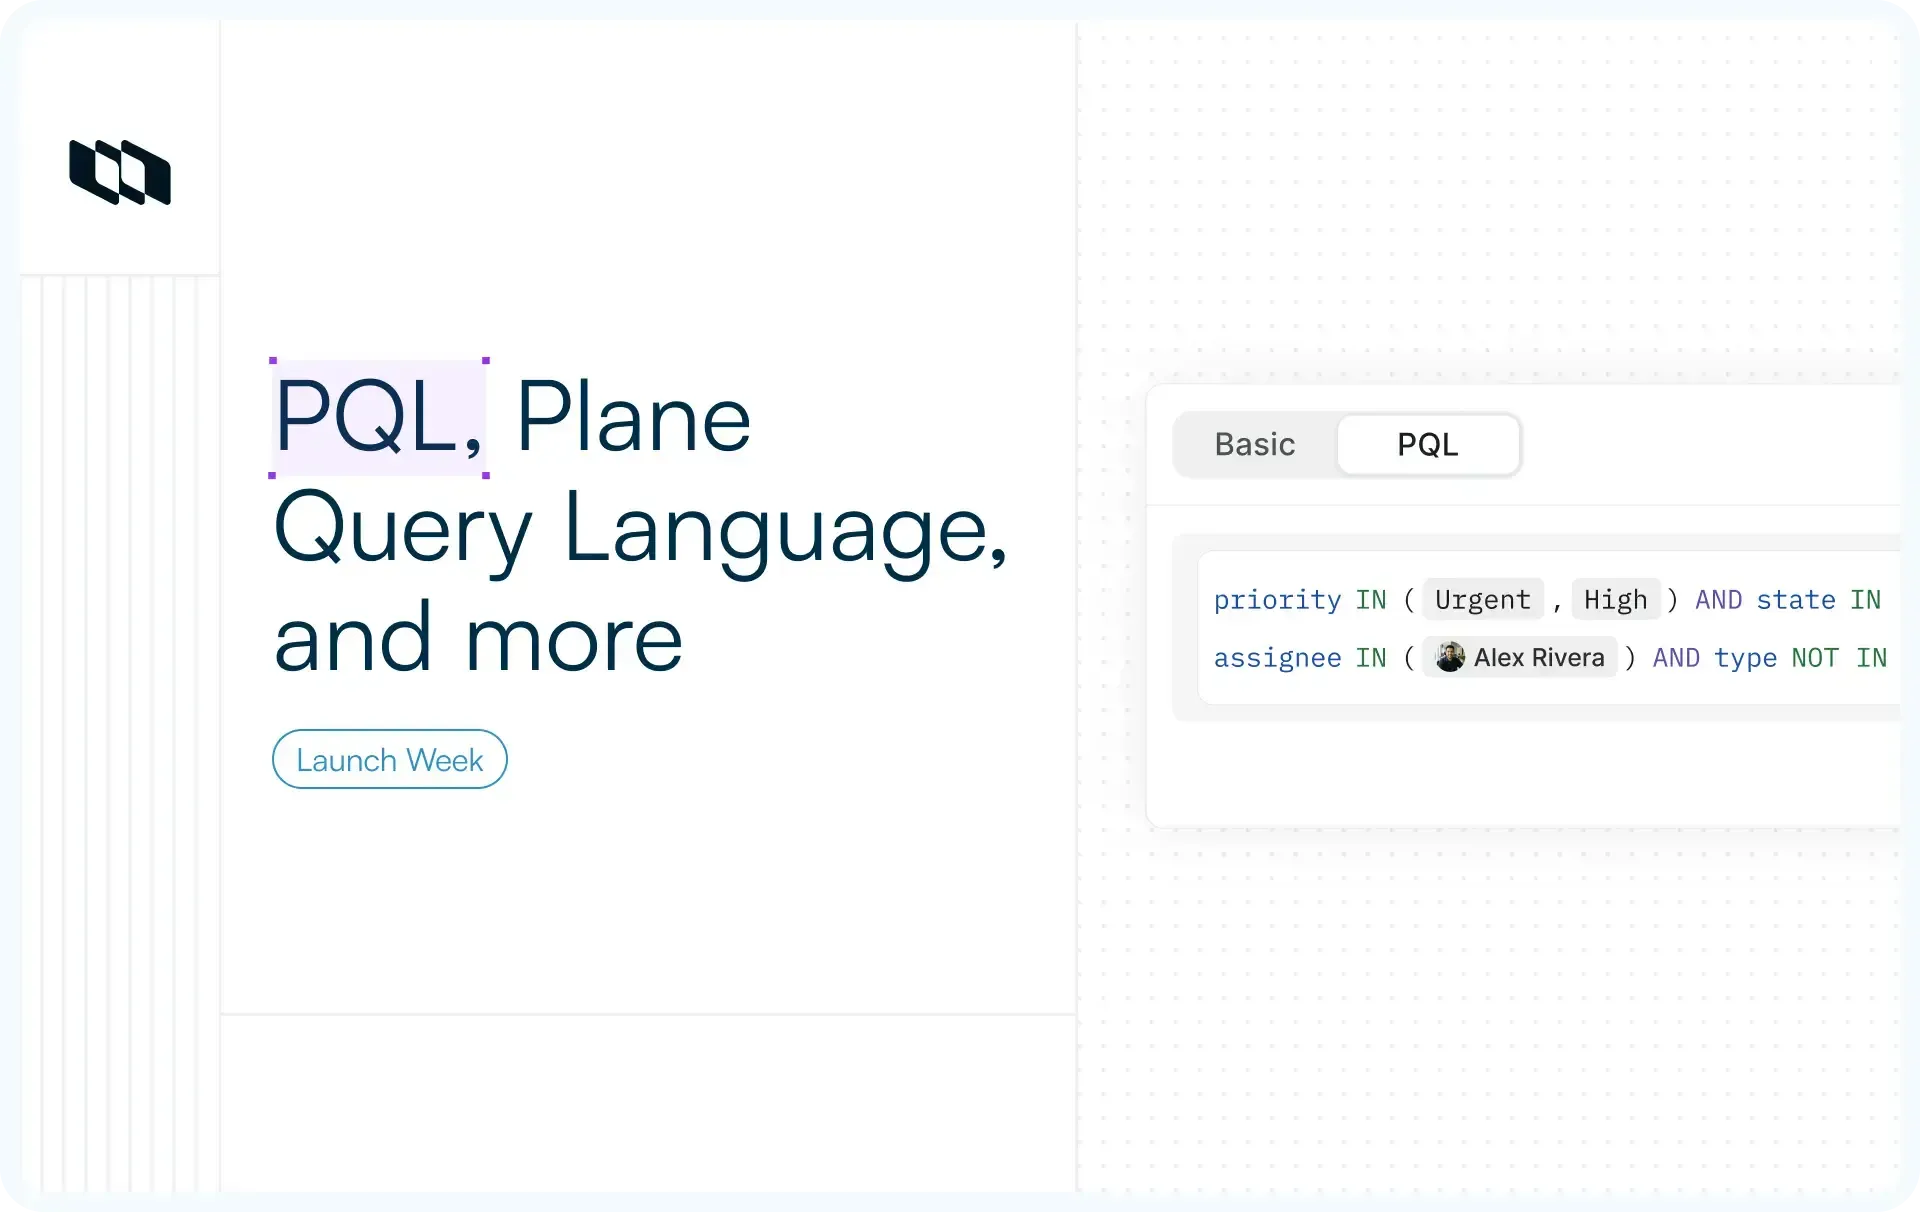
- PQL, Plane Query Language
A query language for filtering and shaping work items beyond what the standard filter UI can express. - Text to PQL using AI
Describe what you want in plain English. Plane writes the PQL. Enterprise. - PQL in dashboards
Use the same query language at three levels: source, quick, and widget filters. - Enhanced dashboards, quick filters, table widget
A redesigned dashboard surface, three-level filter hierarchy, and a new tabular widget. - Interactive charts
Compose chart breakdowns by metric and dimension on the page, then drill down by clicking into segments.
How it works
1. PQL, Plane Query Language
While Plane’s standard filter UI effectively handles most filtering tasks, it can reach its limits when teams require compound conditions, nested logic, or queries that blend custom properties with built-in fields. In these advanced scenarios, PQL provides the precision and flexibility needed to manage complex data.
Query structure. PQL queries follow a simple Field Operator Value pattern. priority = High Returns every work item with priority High. state = Todo OR state = "In Progress" returns either. Logical operators (AND, OR) and parentheses let you build expressions that the standard filter UI can't:
(priority = High AND state in (Backlog, "In Progress", Todo)) OR (type in (Bug, Task, Improvements) AND assignee in (Ethan, Parker, Amanda))
Build it without memorizing
- Click PQL in the filter bar to switch into PQL mode.
- As you type, a dropdown surfaces available fields, then operators valid for that field type, then values.
- You build queries without memorizing syntax; the language just becomes the artifact.
Operators per field type
id, title, type, state, stateGroup, assignee, priority, mention, label, cycle, module, milestone, startDate, dueDate, createdAt, updatedAt, createdBy.
Operators are typed to the field:
INandNOT INfor collectionsBETWEENfor date rangesIS NULLfor absence~for "contains text" on strings
Custom properties are queryable too, by their type, text, number, dropdown, boolean, date, member picker, or URL.
Built-in functions for the common boolean cases
A small set of functions covers questions you'd otherwise have to compose:
isOverdue: Due date is past, and the state is openhasNoAssignee: No assigneehasNoLabel: No labelsisTopLevel: Not a sub-work itemisSubWorkItem: Is a sub-work itemhasChildren: Has at least one sub-work itemhasStartAndDueDates: Has both dates set
Where PQL works
Anywhere work items are listed: Work items, Cycles, Modules, Views, Teamspace work items, Workspace views, and Dashboards.
Save as a view
Once a query is right, click Save view. The query becomes a named view you can reopen, share, and use as a starting point for the next query.
For the full operator reference and field list, see the PQL docs.
2. Text to PQL using AI
PQL is powerful, but like any new query language, it comes with a learning curve. Text-to-PQL serves as the essential on-ramp to bridge that gap and get you started instantly.
Describe what you want in plain English:
- High-priority bugs assigned to me that haven't moved in two weeks.
- All work items in the Billing module created this quarter that have no labels.
- Sub-work items of anything assigned to Priya, due before next Friday.
Plane writes the PQL. You can run it as-is, edit it, or tweak the prompt and try again. The generated query is fully editable, which makes Text to PQL one of the better ways to learn the language: you describe what you want, see how PQL expresses it, and the next time you reach for the syntax directly.
The query language remains the definitive source of truth; AI is simply the most efficient path to reach it.
3. PQL in dashboards
The application of PQL is not limited only to the work items list. The same query language extends into dashboards at three levels, and which level you use depends on the question you're asking:
- Source filters define the dashboard's working set: which projects the data comes from and which work items qualify. PQL works here, so the dashboard's source set is exactly the slice of work you want to track. Set it once.
- Quick filters sit in the dashboard header and overlay on top of the source. Useful for "look at the same dashboard through a different lens" without rebuilding it. Quick filters are not persistent; reload the page, and they're gone. They're meant for in-session exploration, not durable configuration.
- Widget filters live on individual widgets, independent of dashboard-level filters. PQL works here too, so a single dashboard can have one widget showing all open bugs and another showing only the urgent ones.
The same syntax from section 1 works at all three levels. Build a query once, save it as a view, and point any number of widgets at it.
4. Enhanced dashboards, quick filters, table widget
Dashboards get a redesigned surface in this release. The three-level filter hierarchy above is the structural change; the table widget and drill-down behavior are the additions on top of it.
- Table widget
A new widget type that renders work items as a table. Configure the row basis and column basis to get the breakdown you want. Useful for the parts of a status dashboard that need detail, not just totals. "Show me every P1 bug by assignee, with state and due date" is a table, not a chart. - Click into a chart segment to drill down
Click a bar, slice, or segment representing a group of work items, and Plane opens the list of those items with the corresponding filters already applied. The chart isn't a dead-end visualization; it's a starting point for the underlying work.
5. Interactive charts
Ask Plane AI for a breakdown and the chart renders inside the Sidecar conversation. Choose what to measure and break it down by any dimension that matters: priority, assignee, state, labels, or cycles. The visual breakdown makes proportions and outliers obvious at a glance.
The chart is interactive in the chat. Hover any state in the legend or any point on the chart to read the numbers behind it, without leaving the conversation to inspect the data.
Power-user move: Combine isOverdue with a priority filter: isOverdue AND priority in (Urgent, High). Save it as a view, point a dashboard widget at the same query, and you have a live count of high-priority work that's slipping. The same query language drives the list, the view, and the dashboard tile.
Availability across plans
Feature | Plan |
PQL, Plane Query Language | Enterprise |
Text to PQL using AI | Enterprise |
PQL in dashboards | Enterprise |
Enhanced dashboards, quick filters, table widget | Pro+ |
Interactive charts | Pro+ |
Recommended for you