What is observability in software engineering?
Introduction
Modern software rarely runs as a single, self-contained system. Applications depend on APIs, databases, cloud infrastructure, microservices, and third-party services, which makes failures harder to trace when something goes wrong. Observability in software engineering gives teams the visibility needed to understand system behavior through telemetry such as logs, metrics, and traces. Strong software observability helps engineers investigate issues faster, connect symptoms to root causes, and see how changes affect users. This guide explains what observability is, how it works, and how teams build it into modern software systems.
What is observability in software engineering?
Observability in software engineering is the ability to understand a system’s internal behavior from the data it produces while running. It helps engineers investigate how an application is behaving, what caused a failure, and which parts of the system contributed to it.
The concept comes from control theory, but in software engineering it is applied through telemetry generated by applications, services, infrastructure, and their dependencies.
From control theory to software observability
In control theory, a system is considered observable when its internal state can be inferred from its external outputs. Software observability applies the same principle to applications and infrastructure.
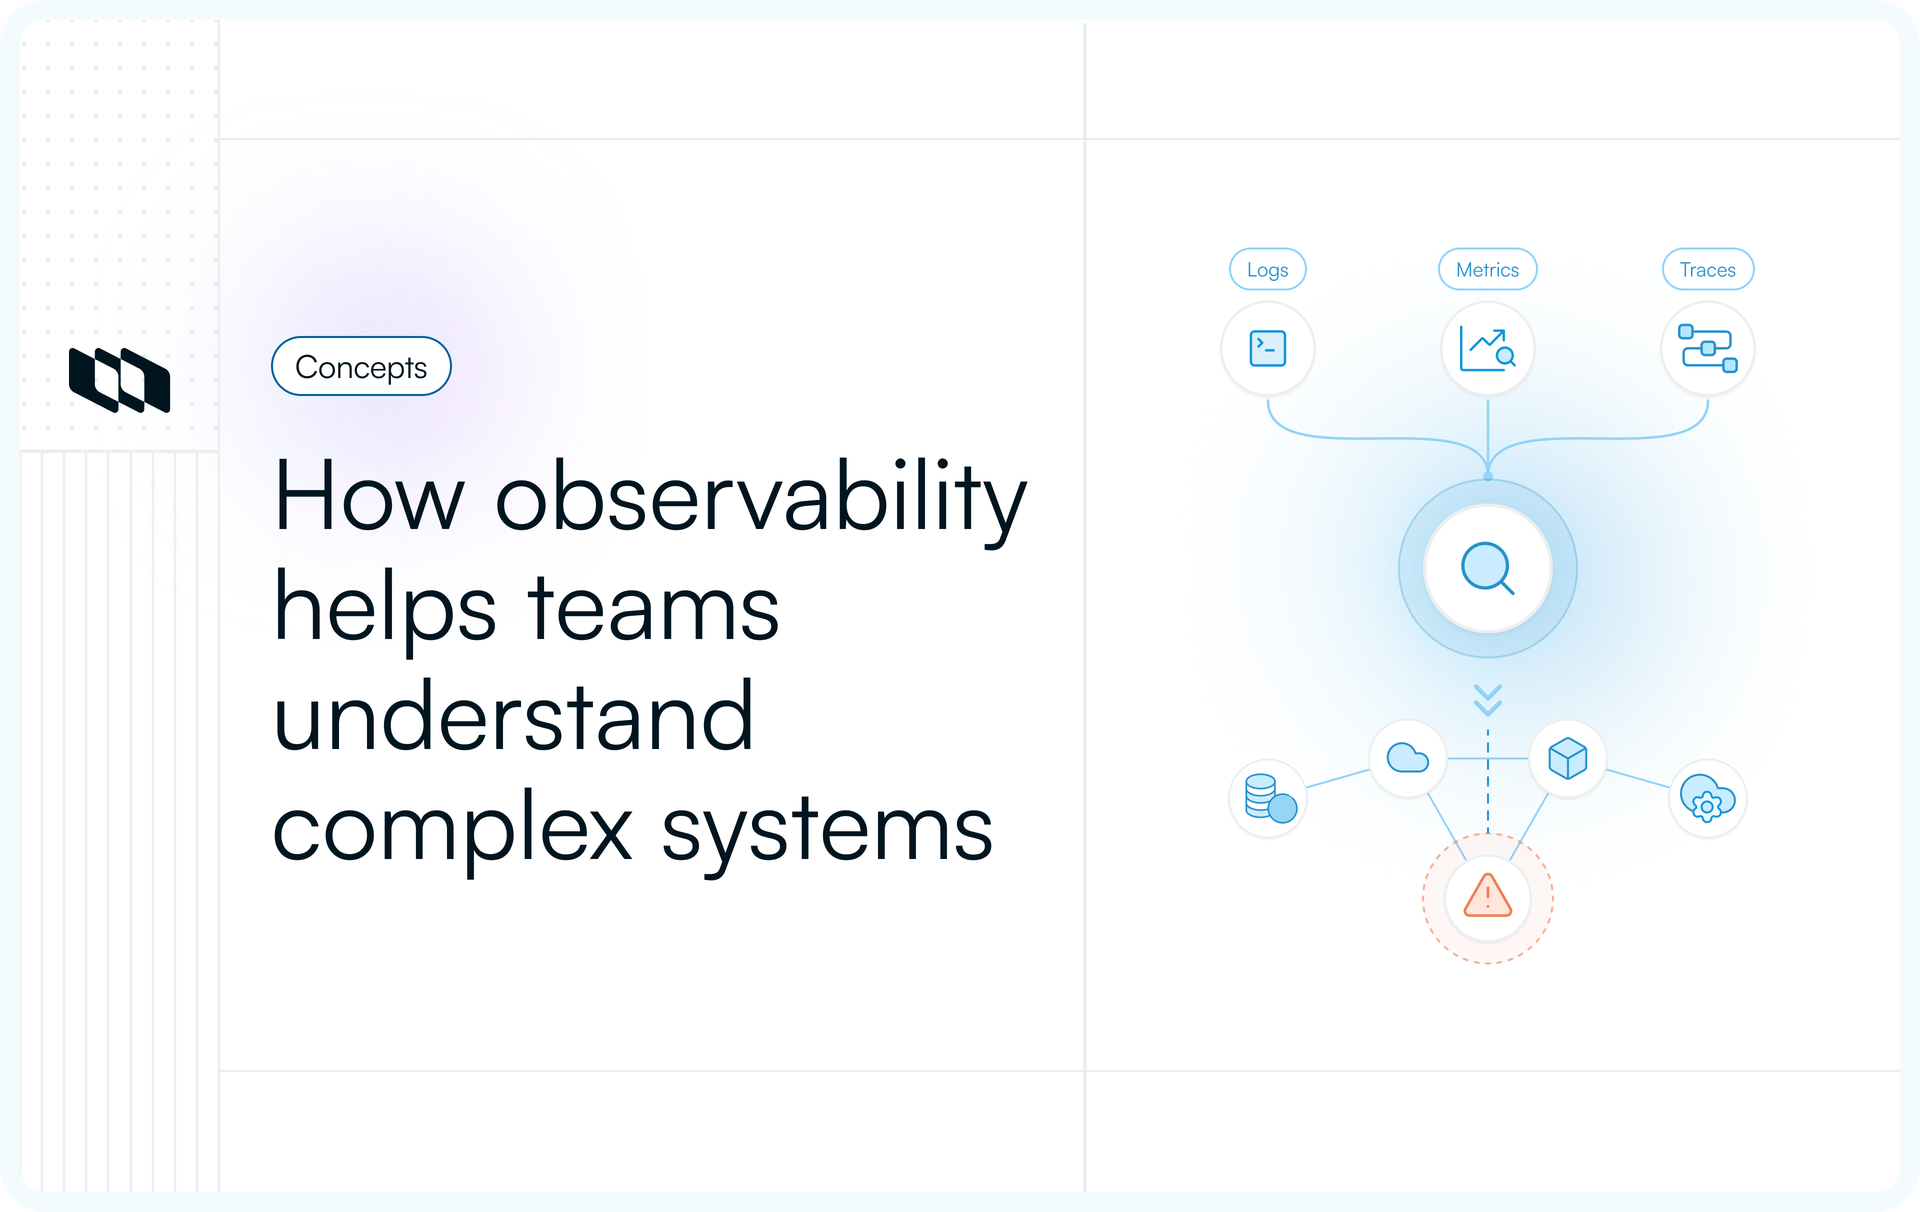
Engineers cannot inspect every internal process of a distributed application directly. Instead, they examine the signals the system exposes to reconstruct what happened. These signals are collectively known as telemetry and commonly include:
- Metrics: Numerical measurements such as latency, error rate, CPU usage, or request volume.
- Logs: Detailed records of events and actions produced by applications and infrastructure.
- Traces: Records that follow individual requests as they travel across services.
- Events and contextual data: Information about deployments, configuration changes, dependencies, environments, and other factors that help explain system behavior.
Together, these signals give engineers a view into how the system is behaving in production.
What makes a software system observable?
An observable system produces enough relevant and connected telemetry for engineers to investigate problems without having to predict every possible failure beforehand.
For example, an engineer investigating a sudden increase in response time might use a metric to identify when latency increased, follow a trace to locate the affected service, and inspect logs to find the database query or dependency responsible for the slowdown.
Strong software observability typically depends on a few characteristics:
- Telemetry is generated across important applications, services, and infrastructure.
- Signals contain enough context to connect related activity across the system.
- Engineers can query and explore the data beyond predefined dashboards.
- Requests can be followed across service and dependency boundaries.
- Production changes, such as deployments or configuration updates, can be correlated with changes in system behavior.
This ability to explore matters because modern distributed systems can fail in ways teams have never encountered before. Monitoring can surface conditions engineers already know to watch for, while observability gives them the context needed to investigate unfamiliar behavior as it emerges.
Observability itself is therefore a system capability and engineering practice. Observability tools support that capability by collecting, storing, correlating, querying, and visualizing telemetry. Their usefulness ultimately depends on the quality of the instrumentation and context the underlying system provides.
Why is observability important in modern software systems?
Modern applications span more services, environments, and infrastructure layers than traditional monolithic systems. Observability gives engineering teams the context they need to understand how those moving parts behave together and where problems originate.
- Distributed architectures create more failure paths: A single issue can originate in an application service, database, queue, network layer, or infrastructure component, making root-cause analysis harder without connected telemetry.
- Microservices spread requests across multiple services: One user request may pass through several services before completing. Observability helps engineers trace that request across service boundaries and identify where latency or errors were introduced.
- Cloud, containers, and serverless systems change constantly: Instances can scale, restart, or disappear quickly. Observability preserves the runtime context engineers need to investigate behavior across dynamic infrastructure.
- Frequent deployments continuously change production behavior: New code, configuration changes, and dependency updates can affect performance or reliability. Observability helps teams correlate those changes with what happens after release.
- Predefined dashboards cannot anticipate every failure: Alerts are useful for known conditions, but unexpected failures often require engineers to explore telemetry and ask new questions during an investigation.
- Observability connects technical issues with user impact: Engineers can understand which services are affected, how severe the problem is, and whether users are experiencing slower responses, failed requests, or degraded functionality.
How does observability work?
Observability works as a continuous loop that starts with generating telemetry and ends with engineers using that data to understand, fix, and validate system behavior. The value comes from connecting signals across the application stack rather than examining each source in isolation.
A mature observability setup usually moves through seven stages.
1. Instrument the system
Applications, services, infrastructure, and dependencies need to expose useful runtime data before engineers can understand what is happening inside them. Instrumentation adds the code, libraries, agents, or integrations required to generate that telemetry.
Depending on the system, this may include application logs, service metrics, distributed traces, database activity, infrastructure signals, deployment events, and request metadata. Instrumentation should cover the parts of the system that are most important to reliability and user experience.
2. Collect telemetry
Once telemetry is generated, it needs to be gathered from across the environment. Agents, SDKs, libraries, exporters, and telemetry collectors can collect signals from applications, containers, databases, cloud services, and infrastructure.
In distributed systems, consistent collection is especially important because a single request may cross several services. Missing telemetry from one part of that path can make an otherwise straightforward investigation much harder.
3. Process and enrich the data
Raw telemetry becomes more useful when it includes enough context to explain where an event came from and how it relates to the rest of the system.
Teams commonly enrich telemetry with information such as:
- Service and application name
- Environment, such as production or staging
- Request or trace ID
- Application version
- Deployment identifier
- Region or availability zone
- Host, container, or cluster
- Relevant user or account context where appropriate
Consistent metadata allows engineers to filter, group, and compare signals during an investigation.
4. Store and correlate telemetry
Collected data is sent to an observability backend where it can be stored, indexed, and queried. Correlation then connects related signals across different parts of the system.
For example, the same trace identifier may connect a slow API request with the service that handled it, the database call that caused the delay, and the logs produced during that request. This correlation turns separate pieces of telemetry into a coherent picture of system behavior.
5. Analyze system behavior
Engineers use the collected data to understand both current conditions and longer-term patterns. Depending on the question, they might use dashboards, service maps, distributed traces, log searches, metric queries, or dependency views.
A dashboard might reveal that latency started increasing after a deployment. A trace can show which service is responsible, while related logs provide the details needed to understand the underlying failure.
This ability to move between different forms of telemetry is a central part of software observability.
6. Detect and investigate problems
Monitoring rules, thresholds, anomaly detection, and alerts can surface signs that something requires attention. The investigation begins by adding context around that signal.
Engineers may ask:
- Which services are affected?
- When did the behavior start?
- Did a deployment or configuration change happen around the same time?
- Is the issue affecting every request or only a subset?
- Which downstream dependency is contributing to the failure?
- How are users being affected?
Observability in distributed systems is particularly useful here because engineers can follow activity across service boundaries instead of troubleshooting each component separately.
7. Act and validate the fix
Once engineers identify the root cause, they can fix the code, configuration, infrastructure, or dependency responsible for the issue. The same telemetry used during the investigation then helps validate the result.
Teams can check whether error rates returned to normal, latency decreased, failed requests recovered, or affected user journeys began working as expected. This closes the observability loop and turns runtime data into feedback that informs future engineering decisions.
In practice, how observability works in software systems is cyclical. Systems are instrumented, telemetry is collected and analyzed, problems are investigated, fixes are deployed, and their effects are measured. As the architecture evolves, the observability setup evolves with it.
What are the three pillars of observability?
The three pillars of observability are metrics, logs, and traces. Each captures a different view of system behavior, and together they help engineers move from detecting an issue to understanding its cause. In practice, their value comes from how well teams can correlate them during an investigation.
1. Metrics
Metrics are numerical measurements that show how a system behaves over time. They are useful for tracking trends, spotting changes, and identifying conditions that may require investigation.
Common examples include:
- Request latency
- Throughput
- Error rate
- CPU and memory usage
- Request volume
- Resource saturation
Metrics are especially effective for answering questions such as whether response times are increasing, error rates are rising, or infrastructure is reaching capacity. Because they are aggregated over time, they provide a clear view of system health and make abnormal behavior easier to detect.
2. Logs
Logs are timestamped records of events generated by applications, services, operating systems, and infrastructure. They capture detailed information about what happened at a particular moment.
A log entry might record:
- An application error
- A failed authentication attempt
- A database query
- A configuration change
- A request to an external API
- A background job starting or failing
Logs are valuable during debugging because they provide detailed context around a specific event. Structured logs are particularly useful because fields such as service name, request ID, environment, error code, or user context can be searched and correlated with other telemetry.
3. Traces
Traces show how an individual request moves through a distributed system. They are especially important in microservices architectures, where one user action may pass through several services before completing.
A trace is made up of spans, with each span representing a unit of work such as an API call, database query, or service operation. Together, these spans show the complete request path, including dependencies and the amount of time spent at each step.
Traces help engineers identify:
- Which service introduced latency
- Where a request failed
- Which downstream dependency caused a delay
- How services interact during a transaction
- Which part of a distributed workflow requires investigation
How logs, metrics, and traces work together
The three signals become much more useful when engineers can move between them during the same investigation.
Consider an API whose response time suddenly increases:
A metric shows that latency has spiked → a trace identifies the service where the request is slowing down → related logs reveal that a database query is timing out.
Metrics provide the signal that something changed, traces show where the problem is occurring, and logs supply the detailed context needed to understand why.
This relationship is why the three pillars of observability are often treated as the foundation of software observability. The next step is ensuring those signals carry enough shared context to be correlated across the system.
Are logs, metrics, and traces enough for observability?
Logs, metrics, and traces provide the foundation for observability, but collecting all three does not automatically make a system observable. Engineers also need enough context to connect those signals and investigate questions that were not anticipated when dashboards or alerts were created.
Useful observability data can also include:
- Events and deployment changes: Show when releases, configuration updates, or infrastructure changes occurred.
- Application and infrastructure metadata: Adds context such as service, environment, version, region, host, or container.
- Service dependencies and topology: Shows how services communicate and which dependencies may be contributing to a failure.
- Profiles: Reveal how applications consume CPU, memory, and other resources at the code level.
- Real-user and experience data: Helps connect backend behavior with latency, errors, and other issues users actually experience.
- High-cardinality data: Allows engineers to investigate specific requests, users, services, endpoints, or other detailed dimensions.
The goal is to make telemetry easy to correlate and explore. An observable system gives engineers enough context to move between signals, follow unexpected behavior across components, and ask new questions as an investigation develops.
What is the difference between observability and monitoring?
Monitoring and observability both help engineering teams understand system health, but they support different parts of the investigation process. Monitoring is usually built around predefined signals and conditions, while observability gives engineers the broader context needed to explore system behavior when the cause of a problem is unclear.
Aspect | Monitoring | Observability |
Primary purpose | Tracks system health and detects known conditions | Helps engineers understand system behavior and investigate causes |
Problems handled | Works well for known failure patterns | Supports both expected and previously unknown problems |
Dashboards and alerts | Relies heavily on predefined metrics, thresholds, and alerts | Allows engineers to explore telemetry beyond predefined views |
Investigation style | Answers specific questions teams already know to ask | Supports open-ended investigation as new questions emerge |
Context and correlation | Often focuses on individual signals or components | Connects logs, metrics, traces, events, and metadata across systems |
Root-cause analysis | Signals that something may be wrong | Provides the context needed to determine where and why it happened |
Typical use cases | Availability checks, threshold alerts, resource monitoring | Distributed debugging, incident investigation, performance analysis |
Monitoring and observability work best together. Monitoring can surface the first indication that something has changed, such as a spike in error rates or latency. Observability then helps engineers trace that signal across services, dependencies, and telemetry to understand the underlying cause and user impact.
Observability vs. APM
Application performance monitoring, or APM, focuses on the health and performance of software applications. APM tools commonly track response times, transactions, errors, throughput, and dependencies to help teams identify performance issues.
Observability has a broader scope. It connects application behavior with infrastructure, distributed services, logs, traces, deployment events, and other contextual telemetry. This gives engineers more flexibility when investigating complex failures that span several layers of a system.
In practice, APM can form part of an observability strategy, especially when application performance is one of the primary signals teams need to understand.
What are the main benefits of observability?
Observability gives engineering teams a clearer view of how software behaves in production and helps them respond to problems with better context. Its value shows up across debugging, reliability, performance, and software delivery.
- Faster troubleshooting and root-cause analysis: Engineers can correlate metrics, traces, logs, and contextual data to narrow down where a problem started and what caused it.
- Lower mean time to detection and resolution: Better visibility helps teams identify abnormal behavior earlier and move from an alert to a diagnosis more quickly during incidents.
- Better system reliability and availability: Observability helps teams identify recurring failure patterns, unstable dependencies, and capacity issues before they develop into larger reliability problems.
- Improved application performance: Engineers can uncover slow services, inefficient database queries, resource bottlenecks, and latency across distributed request paths.
- More confidence in software releases: Teams can compare system behavior before and after deployments, spot regressions quickly, and verify whether a new release is performing as expected.
Where is observability used in software engineering?
Observability is used anywhere engineers need to understand how software behaves under real operating conditions. Its most common applications span debugging, incident response, performance analysis, reliability engineering, and release validation.
1. Production debugging
Engineers use observability to investigate unexpected application behavior by tracing errors across services, examining logs, and comparing runtime signals around the time a failure occurred.
2. Incident detection and response
During incidents, observability helps teams determine which services are affected, assess severity, identify root causes, and verify whether remediation has restored normal behavior.
3. Performance optimization
Metrics, traces, and profiling data can reveal slow endpoints, inefficient database queries, resource constraints, and dependencies that contribute to latency.
4. Microservices and distributed systems
Observability in distributed systems helps engineers follow requests across interconnected services and understand how failures or delays propagate through dependencies.
5. Cloud infrastructure and Kubernetes
Teams can correlate application behavior with infrastructure signals such as container restarts, CPU usage, memory pressure, node health, or scaling events.
6. CI/CD and release validation
Observability helps teams compare behavior before and after deployments, detect regressions, and confirm whether a release is performing as expected in production.
7. Site reliability engineering
SRE teams use telemetry to track service level indicators, evaluate service level objectives, manage error budgets, and investigate recurring reliability issues.
8. User-experience monitoring
Real-user and frontend telemetry helps teams connect backend performance with actual user outcomes, such as slow page loads, failed transactions, or degraded application responsiveness.
What is OpenTelemetry, and how does it support observability?
OpenTelemetry, often shortened to OTel, is an open-source observability framework for instrumenting software and collecting telemetry in a standardized way. It provides common APIs, SDKs, protocols, and tools for working with traces, metrics, and logs across different applications and infrastructure environments.
Its vendor-neutral approach allows teams to instrument services without tying their telemetry pipeline to a single observability provider.
How does OpenTelemetry collect telemetry?
OpenTelemetry supports two main approaches to instrumentation:
- Automatic instrumentation captures telemetry from supported frameworks, libraries, and runtimes with little or no application code changes.
- Manual instrumentation lets developers add telemetry directly to their code using OpenTelemetry APIs and SDKs. This is useful when teams need application-specific spans, metrics, attributes, or other context.
Teams can use both approaches within the same system. Automatic instrumentation provides broad coverage, while manual instrumentation adds detail around the parts of an application that matter most.
What are the common challenges of observability?
Building observability across modern software systems introduces its own operational and technical challenges. As systems grow, teams have to manage the volume, quality, cost, and consistency of telemetry without making investigation harder.
- High telemetry volume: Distributed applications can generate enormous amounts of logs, metrics, and traces. Teams need sampling, filtering, and retention policies to keep the data manageable.
- Storage and ingestion costs: Collecting every available signal can become expensive, especially at scale. Teams need to decide which telemetry deserves high-fidelity retention and which data can be sampled or stored for shorter periods.
- Data silos and tool sprawl: Telemetry may be spread across separate logging, infrastructure monitoring, APM, and cloud tools. This fragmentation makes it harder to correlate signals during an incident.
- Alert fatigue and noisy signals: Excessive or poorly configured alerts can overwhelm engineers and make important incidents harder to recognize. Alerts are most useful when they represent conditions that require a clear response.
- Missing context or poor telemetry quality: A large volume of data has limited value when it lacks request IDs, service metadata, deployment information, or other context needed to connect related events.
- Privacy and security risks: Logs and traces can contain user information, credentials, tokens, or other sensitive data if telemetry is collected without appropriate controls. Teams need clear rules for redaction, access, and retention.
More telemetry does not automatically create better observability. Teams get more value from signals that are relevant, consistently instrumented, rich in context, and easy to correlate across the system.
How does observability fit into the software engineering lifecycle?
Observability connects software delivery with what happens after code reaches production. It gives engineering teams a continuous feedback loop between releases, runtime behavior, incident response, and future development work.
Build → deploy → observe → detect → investigate → prioritize → fix → release → validate → learn
1. Build, deploy, and observe
Engineers release new code, configuration changes, or infrastructure updates. Once those changes reach production, telemetry shows how the system behaves under real workloads.
Teams can track:
- Error rates
- Latency and throughput
- Resource usage
- Distributed request paths
- Deployment-related changes in behavior
2. Detect and investigate problems
Issues may surface through alerts, incidents, support reports, or routine analysis. Engineers then use logs, metrics, traces, and contextual data to understand what changed and where the problem originated.
The investigation usually focuses on:
- Which services are affected
- When the issue started
- What changed before the issue appeared
- Which users or workflows are impacted
- What the likely root cause is
3. Prioritize and fix the work
Once the cause is understood, the findings become actionable engineering work. This may include:
- Bugs
- Reliability improvements
- Performance fixes
- Infrastructure changes
- Technical debt
- Additional instrumentation
Teams can capture these findings as work items in Plane, assign ownership, prioritize them alongside other engineering work, and track the fix through development and release.
4. Validate and learn
After the fix is deployed, observability helps confirm whether the change worked. Teams can verify that error rates have fallen, latency has improved, or the affected user journey is behaving normally again.
The findings from the incident can also feed back into future work, such as improving alerts, adding missing telemetry, updating runbooks, or addressing recurring reliability risks.
This makes observability part of the broader software engineering lifecycle, with production behavior continuously informing what teams build, fix, and improve next.
Final thoughts
Observability gives engineering teams a practical way to understand how software behaves once it is running in production. Metrics, logs, traces, deployment events, and contextual telemetry become most valuable when teams can connect them and use them to investigate real questions about reliability, performance, and user impact.
As systems become more distributed, that ability matters even more. Strong observability helps teams move from detecting a symptom to identifying its cause, turning the findings into engineering work, and validating whether the eventual fix improved the system.
For teams building modern software, observability is increasingly part of the development lifecycle itself, shaping how they debug, operate, release, and improve software over time.
Frequently asked questions
Q1. Is observability a part of DevOps?
Yes. Observability is an important part of DevOps because it gives development and operations teams shared visibility into how software behaves in production. Teams use logs, metrics, traces, and other telemetry to detect problems, investigate root causes, evaluate releases, and improve system reliability throughout the software delivery lifecycle.
Q2. What are the three pillars of observability?
The three traditional pillars of observability are logs, metrics, and traces. Logs record detailed events, metrics measure system behavior over time, and traces follow requests across distributed services. Together, they help engineers detect issues, understand where failures occur, and investigate their underlying causes.
Q3. What are tools for observability?
Observability tools collect, process, analyze, and visualize telemetry from applications and infrastructure. Common examples include Datadog, Dynatrace, New Relic, Grafana, Prometheus, Jaeger, Elastic Observability, and Splunk. OpenTelemetry is also widely used to instrument applications and collect vendor-neutral logs, metrics, and traces for observability backends.
Q4. What is observability in software?
Observability in software is the ability to understand a system’s internal state by analyzing the data it produces, such as logs, metrics, traces, events, and metadata. It helps engineers investigate system behavior, identify root causes, troubleshoot unexpected failures, and understand how software performs under real production conditions.
Q5. What is the difference between observability and monitoring?
Monitoring tracks predefined metrics, thresholds, and conditions to show when a known problem occurs. Observability provides broader context for investigating why that problem occurred and for exploring unexpected behavior. Monitoring is commonly used for detection, while observability supports deeper troubleshooting and root-cause analysis across complex software systems.
Recommended for you



 Download for Mac
 Download for Android